Humanities, Social Science and Language


Digital Products


Connect®
Course management and student learning tools backed by great support.

McGraw Hill GO
Greenlight learning with the new eBook+

ALEKS®
Personalize learning and assessment

ALEKS® Placement, Preparation, and Learning
Achieve accurate math placement

SIMnet
Ignite mastery of MS Office and IT skills

McGraw Hill eBook & ReadAnywhere App
Get learning that fits anytime, anywhere

Sharpen: Study App
A reliable study app for students

Virtual Labs
Flexible, realistic science simulations

AI Reader
Encourage Discovery, Boost Understanding

Services


Affordable Access
Reduce costs and increase success

Learning Management System Integration
Log in and sync up

Content Collections powered by Create®
Curate and deliver your ideal content

Custom Courseware Solutions
Teach your course your way

Education for All
Let’s build a future where every student has a chance to succeed

Business Program
Explore business learning solutions & resources

Professional Services
Collaborate to optimize outcomes

Remote Proctoring
Validate online exams even offsite

Institutional Solutions
Increase engagement, lower costs, and improve access for your students

Evergreen
Updated, relevant materials—without the hassle.

Support


General Help & Support Info
Customer Service & Tech Support contact information

Online Technical Support Center
FAQs, articles, chat, email or phone support

Support At Every Step
Instructor tools, training and resources for ALEKS, Connect & SIMnet

Instructor Sample Requests
Get step by step instructions for requesting an evaluation, exam, or desk copy

Platform System Check
System status in real time

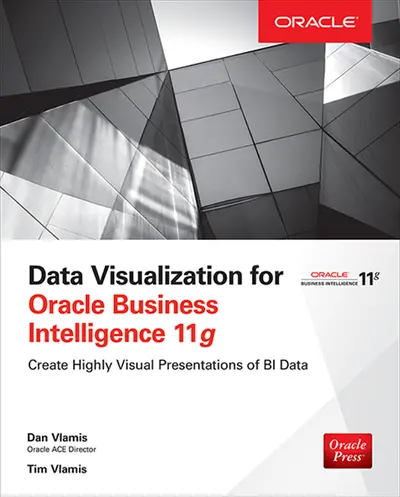
Data Visualization for Oracle Business Intelligence 11g

ISBN10: 0071837264 | ISBN13: 9780071837262

Data Visualization for Oracle Business Intelligence 11g
ISBN10: 0071837264
ISBN13: 9780071837262
By Dan Vlamis and Tim Vlamis

Step 1 . Download Adobe Digital Editions to your PC or Mac desktop/laptop.

Step 2. Register and authorize your Adobe ID (optional). To access your eBook on multiple devices, first create an Adobe ID at account.adobe.com. Then, open Adobe Digital Editions, go to the Help menu, and select "Authorize Computer" to link your Adobe ID.

Step 3. Open Your eBook. Use Adobe Digital Editions to open the file. If the eBook doesn’t open, contact customer service for assistance.

Publisher's Note: Products purchased from Third Party sellers are not guaranteed by the publisher for quality, authenticity, or access to any online entitlements included with the product. Design and Deliver Effective Visual Solutions of BI Data Cowritten by an Oracle ACE Director and an expert in data visualization design specializing in BI and analytics, Data Visualization for Oracle Business Intelligence 11g reveals best practices for presenting data-driven insights with graphs, tables, maps, dashboards, and other methods that will immediately enhance corporate decision-making. Throughout the book, the principles of effective design are emphasized. Leverage the power of this comprehensive business intelligence platform to deliver rich visualizations of business information across the enterprise. Create well-organized tables and pivot tables Convey data insights with line, bar, pie, waterfall, radar, and other graphs Configure MapViews so that you can provide interactive maps and spatial analysis capabilities Build advanced visualizations, including trellis charts, gauges, R images, jQuery sparklines, and more Use Oracle Business Intelligence Publisher to create pixel-perfect reports from various data sources Design effective, interactive BI dashboards Use the Oracle Scorecard and Strategy Management module to measure, evaluate, and manage key performance indicators Make smart color choices using data science tools

1.The case for business intelligence and analytics2.OBI 11g and its position in the future of Oracle BI3.OBI Visualizations --Tables4.OBI Visualizations – Graphs5.Pie graphs6.Alerts and Delivers7.BI Publisher8.Dashboard strategy and design9.Dashboard layout and design10.Dashboard Master Detail Linking11.Dashboard Action Links and Navigation12.Dashboard report links13.Dashboard Prompts14.Strategy Scorecards and KPIs15.Navigation16.Design17.General advice

Need support?   We're here to help - Get real-world support and resources every step of the way.

Top