Teaching to the Edges: The Cutting-Edge Technology Helping Pennsylvania Educators Personalize Learning

With McGraw Hill Plus for PreK-12, educators in the Eastern York School District are transforming classrooms through tailored instruction and real-time insights.


Tags: Article, Blog, Corporate

Administrators at the Eastern York School District piloted McGraw Hill Plus for PreK-12 in their math classes to personalize learning.

Jackson has always liked math. But one area — geometry — threw him for a loop when he was in the 4th grade at Wrightsville Elementary in Wrightsville, PA. For some students, that struggle would end their fondness for the subject. Not Jackson. Instead, he saw it as a challenge. And he loves a good challenge.

Determined to get the hang of concepts like calculating perimeter and area, Jackson doubled down with extra practice at home. Just as importantly, his math teachers, Jerry Schenck and Hannah Zeiset, made sure he had the right support in class. They placed him in small groups with classmates who had a stronger grasp of the material, assigned activities to reinforce key skills, and provided personalized learning resources tailored to his needs.

The hard work eventually paid off. By the spring, Jackson wasn’t just comfortable with 4th grade geometry — he had started doing 5th grade-level math.

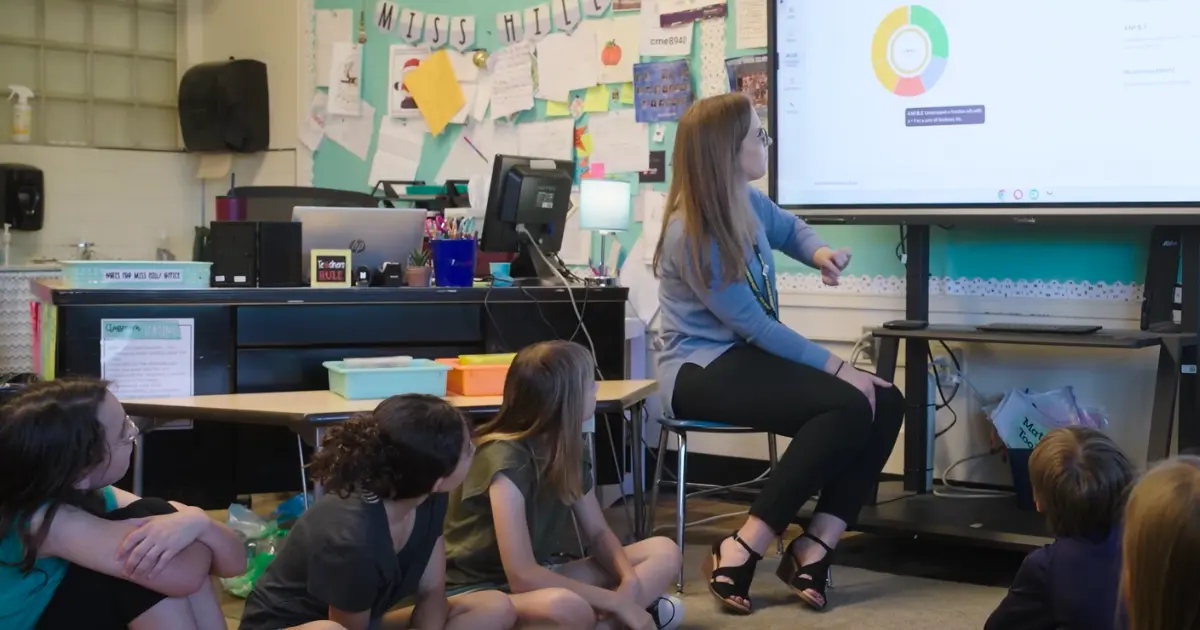
With the right support and personalized resources, Wrightsville Elementary Math Teacher Hannah Zeiset helped Jackson succeed in mastering a once-challenging topic.

Unlocking the potential of personalized learning

Jackson’s success story is exactly what administrators at Eastern York School District in York County, PA, had in mind when they made personalized learning a top priority six years ago. The district’s goal was simple: Meet students wherever they are in their academic journey, and give them the tools they need to excel.

“One of the things we talk about in our district is a jagged learner profile,” explains Superintendent Joe Mancuso. “Some students are strong in one area, not as strong in another. We talk about designing, teaching and learning to the edges. That’s where we meet students.”

In the beginning, teachers would manually pull and analyze data to understand their students’ strengths and challenges and adjust their instruction accordingly. Though useful, the process was laborious and took time away from lesson planning. Administrators were eager to find a solution that automated data analysis, so in the 2023-24 school year, Wrightsville Elementary and nearby Kreutz Creek Elementary piloted McGraw Hill Plus for PreK-12 in their 3rd, 4th and 5th grade math classes. The cutting-edge tool uses student data to generate personalized instructional recommendations.

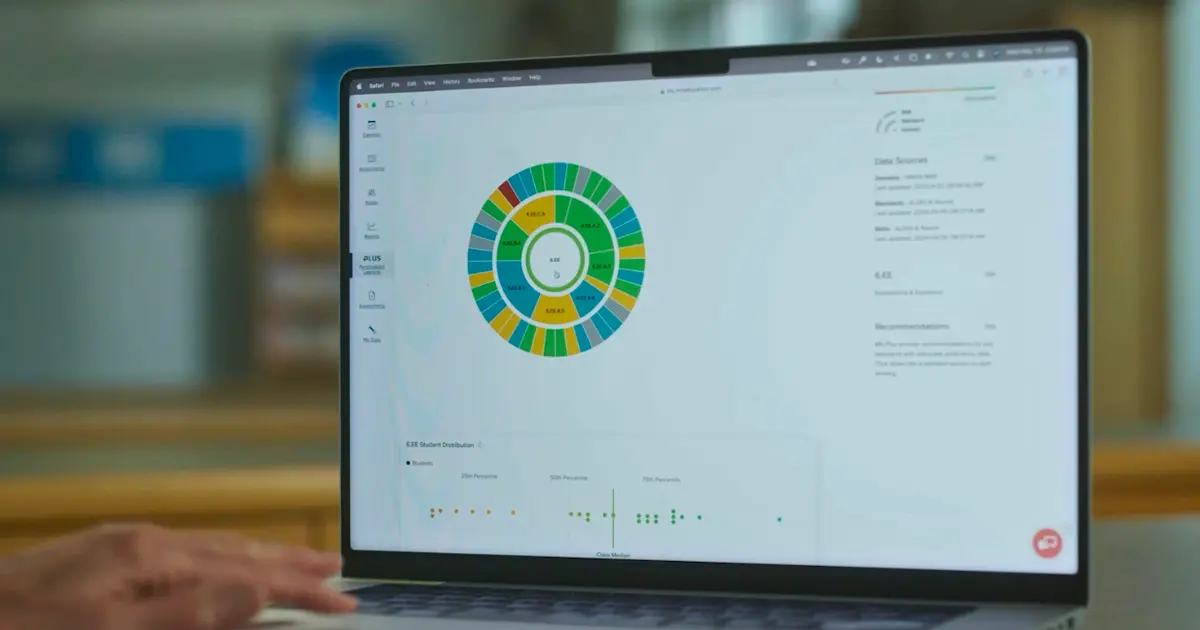
Educators began to see its benefits early on. For starters, the tool gathers student performance data from sources like McGraw Hill’s Reveal Math and ALEKS, as well as nationally normed assessments like NWEA. The tool brings it together into one view called the Standards and Skills Graph. This complex, color-coded sunburst graph shows interim assessment data by grade level and domain, combined with proficiency data on standards and skills. With these insights, educators can adjust lessons on the fly as they see fit. They can also access personalized assignments, small group activities, and flexible grouping recommendations.

Having real-time data analysis at their fingertips has been a game-changer for teachers, says Andrew Pry, principal of Wrightsville Elementary. He likened it to having an extra tool in their toolbox that makes it easier for them to determine what each student needs and how to address those needs.

“One of my teachers said to me, ‘I don’t need that big end-of-unit test anymore because I already have all these data points to say they’ve mastered that skill already,’” Pry says. “So it takes our teachers from being up front, giving direct instruction the whole time, to giving kids what they need and supporting them where they’re at. We’re able to drill down to those kids who aren’t on grade level, and we can bring them up to where they need to be. And that’s what these tools do: help our students be successful.”

The McGraw Hill Plus sunburst graph combines interim assessment data and proficiency metrics, enabling educators to adapt lessons in real time.
The McGraw Hill Plus Standards and Skills Graph shows interim assessment data by grade level and domain, combined with proficiency data on standards and skills, allowing educators to adjust lessons on the fly as they see fit.

Energizing educators and empowering learners

When Zeiset and Schenck, her co-teacher, were introduced to McGraw Hill Plus for PreK-12, they spent some time learning about all the resources available and prioritizing the ones to use in their classes. One of the most valuable has been the flexible small group recommendations, which are updated daily based on each student’s performance and progress.

Group work is a fixture in their math classes, so having access to data-informed clusterings and targeted, skill-specific resources means they’re able to provide students with timely support. “[McGraw Hill Plus for PreK-12] showed me that I can meet the kids who are struggling, and I can meet the kids who are excelling,” Zeiset says.

What’s more, because the grouping is automated, she and Schenck have more time to devote to brainstorming creative in-class projects. For instance, their students have put their math skills to the test by creating their own measuring instruments and building roller coasters online.

But educators aren’t the only ones who are energized. Learners are, too. Keith Shoemaker, the director of teaching and learning for the district, sees their enthusiasm firsthand when he visits classrooms at both schools. Students often show him their color-coded graph and explain the areas they’ve mastered and the ones they’re still working on. “I was a middle school principal, and it was hard for me to get 6th, 7th and 8th grade students to do that,” he says. “But here, you walk into the 4th grade and they’re setting goals for themselves. They’re charting their progress on the walls. They’re excited. And the teachers are celebrating their successes with them. It’s really neat.”

Over the course of his 4th grade math class, Jackson had plenty of those moments with Zeiset and Schenck. When the year wound down, he had a chance to look at his graph and see the progress that he made. “I’ve improved a ton,” he said at the time, with a proud smile. “I’ve done a lot of growing this year.”