Identifying “At Risk” Learning Patterns in the ALEKS Adaptive Learning System

Learning Patterns in ALEKS Adaptive Learning System


By: Jeff Matayoshi and Eric Cosyn
Tags: Learning Science, ALEKS, Data & Analytics

In an adaptive learning system like McGraw-Hill’s ALEKS, students learn material targeted to their specific needs and progress at their own pace. Thanks to the adaptive nature of the technology, it is not generally a concern whether a student is a fast or slow learner, or starts learning from a stronger or weaker foundation, because the system adjusts to the student. But some students may still struggle, and can benefit from the intervention of an instructor.

What if a student engages in cramming behavior? What if a student, who until now was progressing at her own steady pace, starts showing signs of struggling? What if there are changes in the student’s behavior that are symptomatic of possible issues that require attention from the instructor? Ideally, we’d want instructors to be alerted to those situations so that they can intervene and connect with the student before it might be too late.

This summer, we are launching a new tool called ALEKS Insights that leverages machine learning and the data in ALEKS to help solve these problems for instructors. How did we create it? This post explains the research [1] we did here at McGraw-Hill that led to its development.

To design a system that could alert instructors about struggling students, we began by researching and mapping out the various learning patterns shown by anonymous students in the ALEKS system. To get a sense of how students were working in ALEKS, we relied on several statistics that described the learning activity, such as:

  • problems learned per hour of login time
  • rate of access to explanations
  • rate of correct answers
  • problems learned per day in course

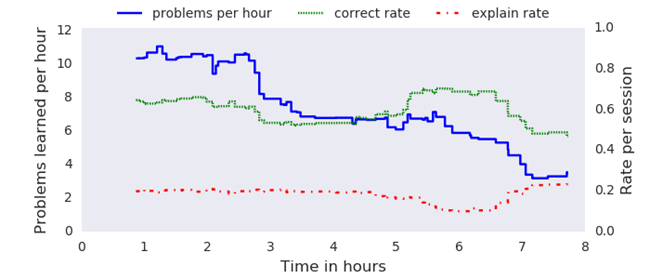
More precisely, we looked at how these statistics evolved for each anonymous student throughout their time in ALEKS. From this, several different types of learning patterns emerged. For example, some students started out making good progress, as shown by a relatively high rate of problems learned per hour.  However, after a certain amount of time, the rate of learning would begin to slow, eventually dropping to a low level.  Here’s an example of such a profile:

Problems learned per hour

This particular student learned at a fast pace for the first few hours in the course, and then his pace began to level off, as shown by the blue line. This situation is typical of many students. However, over the last two hours, the pace began to decline again while the use of the explanation went up. In such a case, making the instructor aware of this slowed progress makes it easier to give the student the extra attention that is necessary.

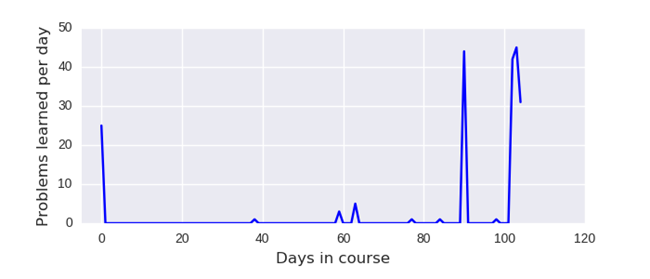
Another example pattern was a cycle of prolonged low activity on the ALEKS technology, possibly indicating procrastination, followed by concentrated bursts of learning activity. As shown below, looking at the problems learned per day was especially helpful for identifying these patterns.

Problems learned per day

This student had three distinct periods of concentrated activity, including three different days in which more than 40 problems were learned, separated by long periods of inactivity. While any learning is preferable to no learning, the benefits of spaced practice are well-known in learning science [2,3], and the student would likely benefit if the learning activity was distributed more evenly. This could be done through the system giving the student reminders or through direct intervention from the instructor.

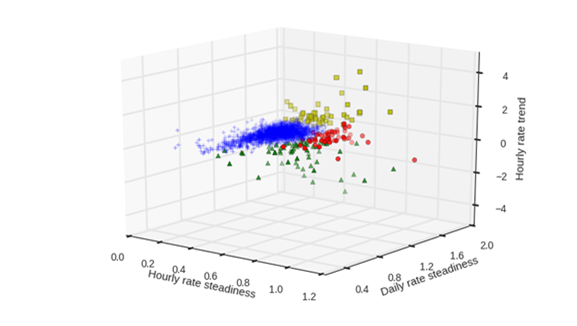
While an experienced instructor would be able to identify the symptomatic patterns, doing so requires a fair amount of manual work, and this procedure would not scale to a class of any significant size. Fortunately, we were able to take advantage of recent advances in machine learning techniques that excel in such a situation. One challenge was to develop a small number of metrics that summarize the rich information carried by the graphs in the above examples. The goal was for the symptomatic patterns to show up as outliers with respect to these metrics. The results are illustrated in the graph below.

chart showing hourly rate steadiness vs daily rate steadiness

What we see here is the output of the machine learning classifier. The dense blue cloud represents the “asymptomatic” student population, that is, the vast majority of students whose learning pattern was not concerning. The green triangles represent students who showed signs of struggling, whereas yellow squares represent students who procrastinated then crammed, and red circles students whose learning patterns were inconsistent in other ways.

You can see clearly that we’re now able to identify outlier learning behavior. From here, we were able to design a tool in ALEKS that can surface this data in a clear, understandable way for instructors, helping them identify the students who fit one of these patterns. This tool is ALEKS Insights, which is currently undergoing beta testing and will be made available to all users this summer.

For more information on McGraw-Hill ALEKS, click here.

[1] Matayoshi, J., and Cosyn, E. (2018). Identifying student learning patterns with semi-supervised machine learning models. Proceedings of the 26th International Conference on Computers in Education, C1: ICCE Sub-Conference on Artificial Intelligence in Education/Intelligent Tutoring Systems (AIED/ITS) and Adaptive Learning, 11-20.

[2] Weinstein, Y., Madan, C.R., and Sumeracki, M.A. (2018) Teaching the science of learning. Cognitive Research: Principles and Implications, 3(2).

[3] Kang, S. H. (2016). Spaced repetition promotes efficient and effective learning: policy implications for instruction. Policy Insights from the Behavioral and Brain Sciences, 3(1), 12-19.

About the authors

Jeff Matayoshi is a Senior Applied Research Scientist at McGraw-Hill.

Eric Cosyn is the Director of Applied Research at McGraw-Hill.