Reporting Administrator User Guide
Use the Reporting Administrator User Guide to understand reports and analytics.
- Customer Support
- PreK-12
- School Administrator
- Preschool
- Elementary School
- Middle School
- High School
- Direct Login & Auto-Rostering
- Direct Login & Manual-Rostering
- SSO & Auto-Rostering
- SSO & Manual-Rostering
- Core
- Intervention
- Supplemental
- AP, Honors & Electives
- Career & Technical Education
- Literacy
- Math
- Science
- Social Studies
- Health
- Visual & Performing Arts
- World Languages
- AP Biology
- AP Chemistry
- AP History & Geography
- AP Psychology
- AP Economics
- AP African American Studies
- AP Precalculus
- AP Statistics
- AP Computer Science
- AP Language and Composition
- AP Public Speaking
- AP Music Theory
- 5 Steps to a 5 - AP Test Prep
- Glencoe Health 2022
- Teen Health 2021
- Arrive Math
- Building Blocks 2024
- Building Blocks PreK 2025
- Number Worlds 2024
- SRA Reading Laboratory 2025
- SRA Reading Mastery Transformations
- Achieve3000 Literacy
- Actively Learn
- McGraw Hill Literacy Emerge!
- McGraw Hill Literacy Summit!
- McGraw Hill Literacy Soar!
- Open Court Reading
- Redbird
- StudySync 2021
- ALEKS
- ALEKS Adventure
- CA Reveal Math (K-12)
- Illustrative Math
- Redbird Math
- Reveal Math (K-12)
- CA Inspire Science 2020
- FL Science 2025 (K-12)
- Inspire Science 2020
- TN Science (K-12)
- TX Science 2025 (K-12)
- CA Impact 2019
- FL Social Studies 2024 (K-12)
- Impact Social Studies
- McGraw Hill Social Studies
- All Sorts 2026 (K-5)
- Asi se Dice 2024
- CTE - Business, Marketing, and Finance
- CTE - Health Science
- CTE - Computing and Technology
- CTE - Agriculture
- CTE - Culinary Arts
- CTE - Early Childhood Education
- CTE - Criminal Justice
- Glencoe Health 2014
- McGraw Hill Health 2014
- 2Inform
- Building Blocks 2015
- Connecting Math Concepts
- Number Worlds 2015
- Corrective Reading
- Early Interventions in Reading
- Spelling Mastery
- WonderWorks 2022 & 2014
- Maravillas 2020 & 2017
- OCR Foundational Skills Kit
- OCR Word Analysis Kit
- StudySync
- StudySync 2015 & 2017
- Wonders
- Wonders 2014
- Wonders 2023 2020 2017
- Wonders Balanced Literacy 2016
- Wonders EL 2016
- World of Wonders 2017
- Core Plus Math 2015
- Everyday Mathematics 4 (K-6)
- Glencoe Algebra 1 2014
- Glencoe Algebra 1 2018
- Glencoe Algebra 2 2014
- Glencoe Math
- Glencoe Math Course 1
- Glencoe Math Course 2
- Glencoe Math Course 3
- Glenoce Algebra 2 2018
- McGraw Hill My Math
- McGraw Hill My Math 2013 & 2016
- McGraw Hill My Math 2018
- Pre-Algebra 2012
- Glencoe Science
- Glencoe Science 2017
- Inspire Science 2017
- iScience 2017
- Networks
- Networks 2014 (K-5)
- Networks 2014 & 2016
- Networks 2018
- Music! Its Role
- Spotlight on Music
- Asi se Dice 2016
- Open Court Reading 2016, 2018, 2023
- Open Court Reading 2025
- Glencoe Geometry 2014
- Glencoe Geometry 2018
- Texas Math
- Glencoe Math Accelerated
- Reports & Analytics
- User Guide
- Back-to-School Setup
- End-of-Year Tasks


McGraw Hill Administrator Reports include interactive student performance, standards, and activity reports. Reporting Administrators also have access to the McGraw Hill Plus reports. Reporting Administrators can also track the number of unique teacher and student logins to determine how many teachers and students are using McGraw Hill digital programs with the Usage reports.
Article Contents
New for the 2026-27 School Year!
- In the Personalized Learning reports, Administrators can now access aggregated can view across all classes, enabling streamlined decision-making and deeper insights. For more information, refer to the Personalized Learning Administrator Report article.
- Administrators now have access to PRoPL reports with school, grade, and class roll-ups. Administrators can view aggregated PRoPL assessment data across their organization, with both Math and Literacy data supported. For more information, refer to the Personalized Learning Administrator Report article.
- Administrators who have teachers using the Achieve3000 Literacy program now have access to Growth and Usage Reports within the Administrator Dashboard. To learn more about these new reports, take a look at the Achieve3000 Literacy Administrator Growth and Usage Report article. For information on the Administrator Dashboard, review the Administrator Dashboard section.
- For districts that use Pearson Review of Progress & Learning (PRoPL), administrators will soon have access to PRoPL reports within the Administrator Dashboard. More information about these reports will be available around the end of August.
Access Administrator Reports
You will need to obtain a Reporting Administrator account to have access to the Standards and Performance reports in the Administrator Dashboard and the Personalized Learning reports. Reach out to an Organization Administrator in your district to request that they create a new Reporting Administrator account if you do not yet have one, or add the Reporting Administrator role to your existing administrator account. District Organization Administrators can create accounts and add roles for teachers and administrators at the district and school level, while School Organization Administrators can only create accounts and add roles for teachers and administrators for the school(s) they are associated with. If you’re an Organization Administrator, you can enable the reporting administrator role for your own account by following the steps in the Add Roles to an Existing User article.
Once you have an account with reporting administrator access, SSO or sign in to your account at my.mheducation.com. If you have a teacher account as well as a reporting administrator account, you will land on the teacher side and will need to switch to your administrator role to view reports. The Administrator Dashboard and Personalized Learning reports will be available in the left navigation menu.
Program-Specific Reports
Some reporting administrators may also see additional program-specific reports on the administrator tools menu, such as ALEKS, Redbird, StudySync, Actively Learn, and Achieve3000 Literacy. Program-specific administrator reports can be found by selecting the appropriate link below:
Report Availability
If for some reason you are not seeing the correct reports, or you're getting an error message when trying to access the administrator reports, refer to the Missing PreK-12 Administrator Reports article for the appropriate steps to take to resolve the issue you're experiencing.
Administrator Dashboard
The Administrator Dashboard report page is available to Organization and Reporting Administrators and includes access to Usage, Standards Performance, and Activity Performance reports. All programs that use McGraw Hill Assess - which includes most Open Learning and select ConnectED programs - will be able to produce reports in the Administrator Dashboard. Programs such as ALEKS, Actively Learn, StudySync, Redbird, or those that use eAssessment will not be available in the reports as they do not use McGraw Hill Assess. View the list of available articles in the Product-Specific Reports section for more information on those available administrator reports.
Note: An assessment has to be assigned and scored before it will show in the Administrator Dashboard.
The Administrator Dashboard is accessible in the navigation menu of the administrator tools (A). The page will default to the Student Performance on Standards bar graph (B). Use the Program (C) and Standard Set (D) drop-downs to view the different data graphs available.
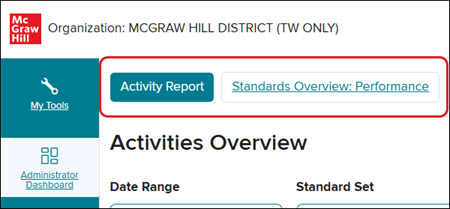
To access the Activity Performance reports, select a Program from the drop-down (C) and click on a Courseware link (E) in the Student Performance on Standards section.
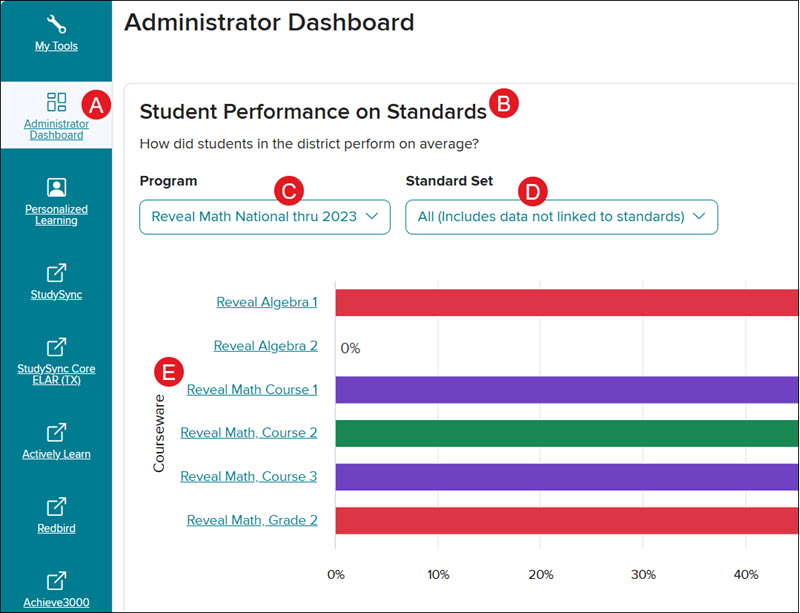
Easily navigate back and forth between the Activity Report and Standards Overview Performance report by clicking on the associated button at the top of the page.
For an in-depth guide on using the Administrator Dashboard, refer to the Access and Navigate the Administrator Dashboard article.
Standards Overview Performance Report
The Standards Overview Performance report for administrators provides the details for classes and students the same as they do for teachers, allowing for clearer communication between teachers and administrators on student progress.
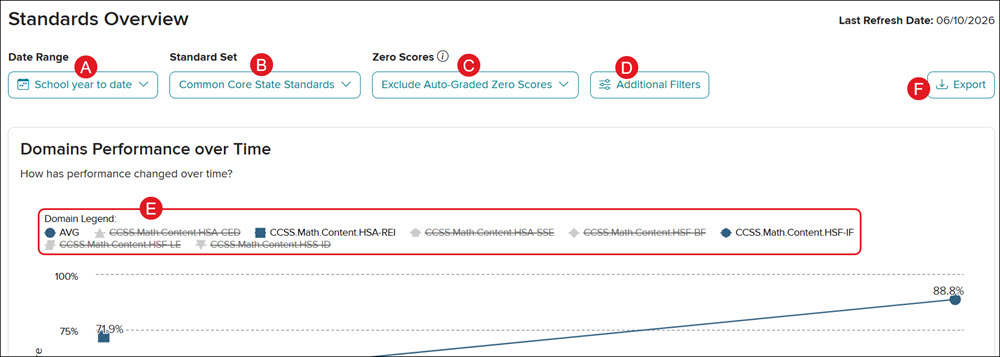
A. Select a Date Range to view the data for Last Day, Last 7 Days, Last 30 Days, School year to date (July 1st - present), or set a Custom range.
- The start of school year is considered to be July 1st. If selecting a Custom date range, you do not want to select more than a year.
B. Select a Standard Set to view specific standards data.
C. Select to Exclude or Include Auto-Graded Zero Scores from the Zero Scores drop-down.
- Exclude auto-graded zero scores: Scores of zero due to non-submission in an auto-graded assessment won't be reported.
- Include auto-graded zero scores: Scores of zero due to non-submission in an auto-graded assessment will be reported.
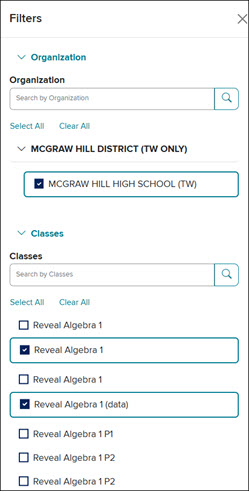
D. Click on the Additional Filters button to select a specific Organization and Class to view.
E. Click on a listed domain in the Domain Legend to add or remove that option from the line graph report view.
F. Click the Export button to export the data into an .xml file.
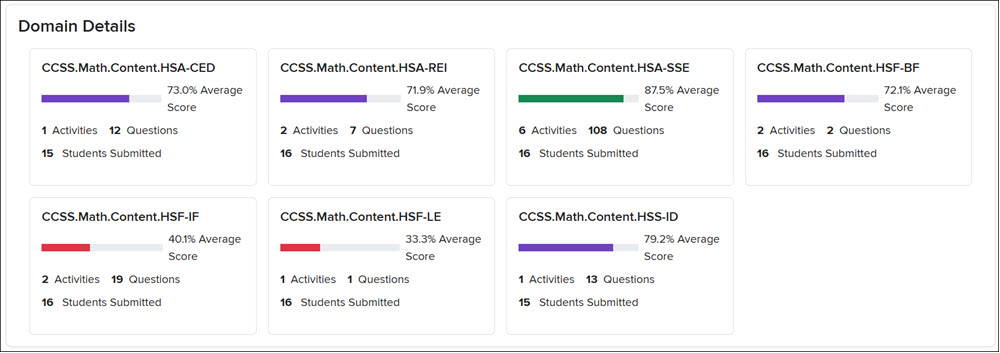
In the Domain Details section below the line graph, click on a standard tile to view a detailed breakdown.
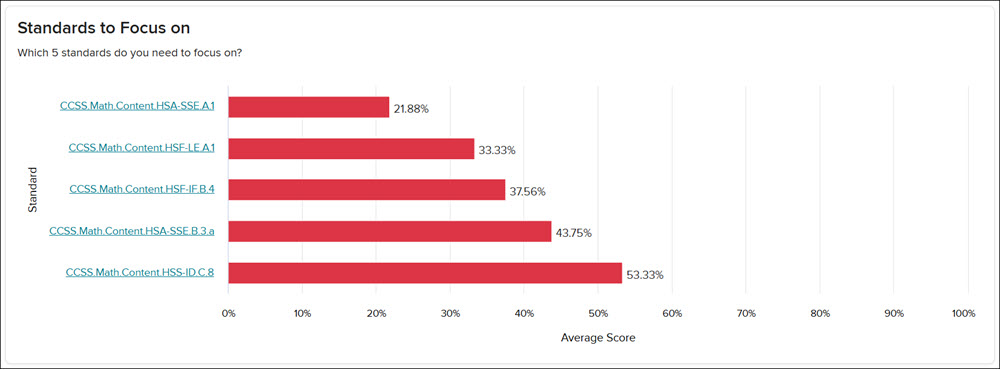
There is also the option of clicking on a Standards to Focus on link.
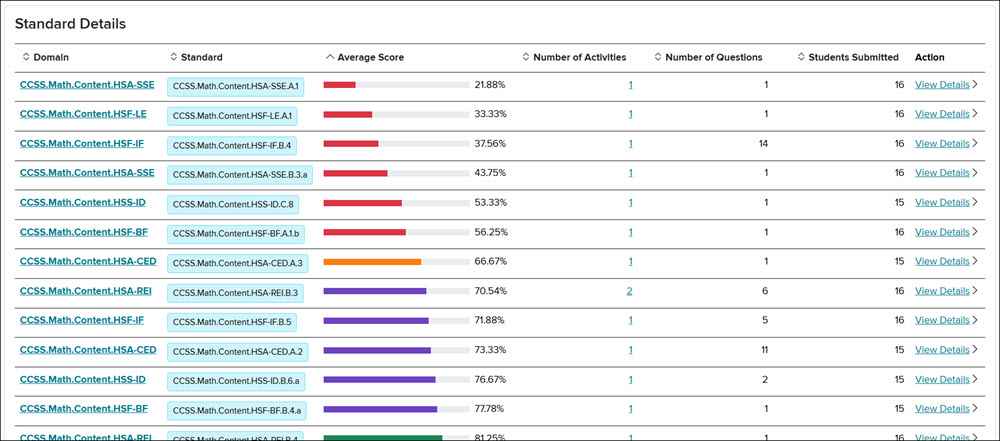
A third option is to click on the Domain link or View Details in the Standard Details section at the bottom of the page.
For more details on the Standards Overview Performance report, view the Access and Navigate the Administrator Dashboard article.
Activity Overview Report
Once a Courseware link has been selected on the Student Performance on Standards screen, it will automatically load the Activities Overview page. This report provides a breakdown of each assessment students have completed for each class.
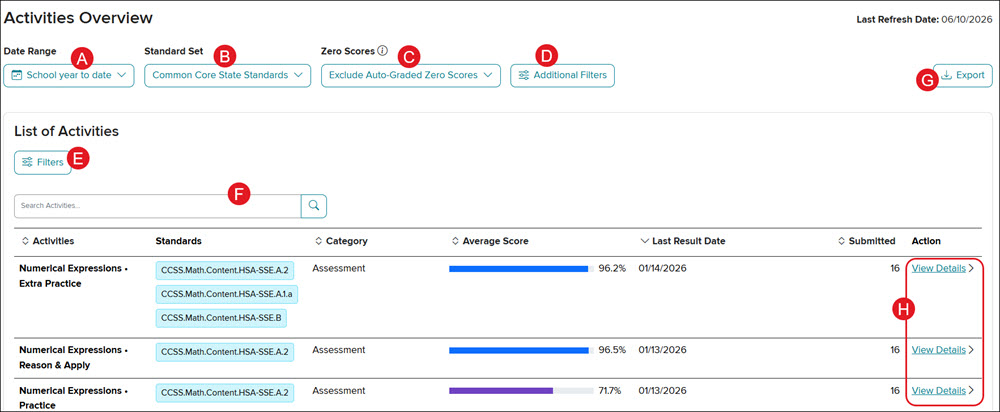
A. Select a Date Range to view the data for Last Day, Last 7 Days, Last 30 Days, School year to date (July 1st - present), or set a Custom range.
- The start of school year is considered to be July 1st. If selecting a Custom date range, you do not want to select more than a year.
B. Select a Standard Set to view specific standards data.
C. Select to Exclude or Include Auto-Graded Zero Scores from the Zero Scores drop-down.
- Exclude auto-graded zero scores: Scores of zero due to non-submission in an auto-graded assessment won't be reported.
- Include auto-graded zero scores: Scores of zero due to non-submission in an auto-graded assessment will be reported.
D. Click on the Additional Filters button to select a specific Organization and Class to view.
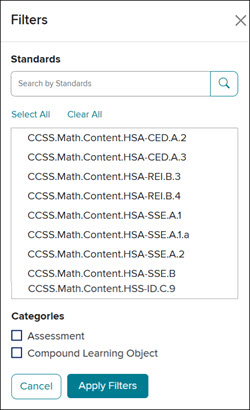
E. Click the Filters button to select to view a certain Standard(s) and/or Categories.
F. Use the Search Activities field to locate a specific assessment.
G. Click the Export button to export the data into an .xml file.
H. Click the View Details link to navigate to the activity Summary and Question Analysis page.
The Summary page will include details on the Type of activity, Total Questions in the activity, the Last result date, and the Average Score. It will also list the Average Score percentage for each school that completed the activity, and a breakdown of the Standards Assessed for the activity.
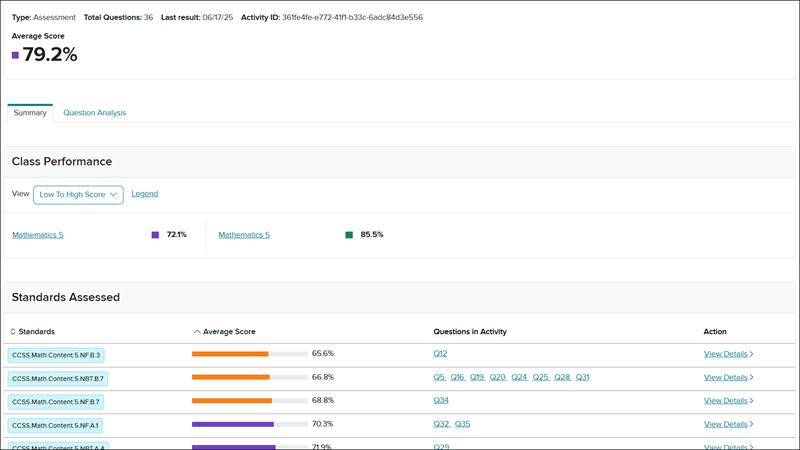
Click on the Question Analysis tab to view the average score percentage for each question in the activity.

For more information about the Activities Overview, Summary, and Question Analysis views, refer to the Access and Navigate the Administrator Dashboard article.
Usage Reports
The Usage Report is available under the Student Performance on Standards section and displays Teacher and Student logins for the Last Day, the Last 7 Days, and the Last 30 Days. It also shows the percentage of teachers and students who have logged in, and the total number of teacher and student accounts associated with the district and each school selected.
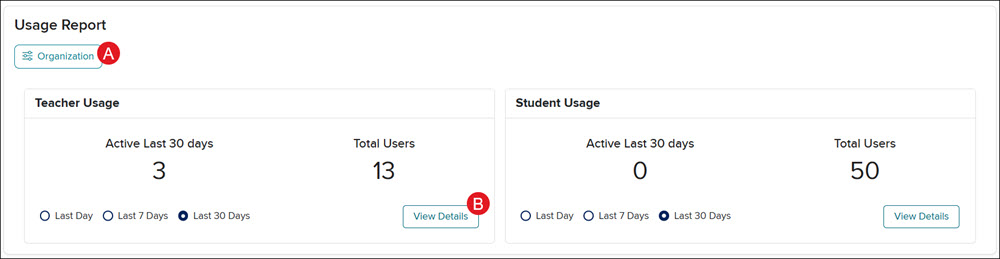
A. Click the Organization button to view the usage data for a specific school.
B. Click the View Details button to view and export Usage data. The data will show the Username, First Name, Last Name, Program, Course, Organization, and Last Login date of each user.
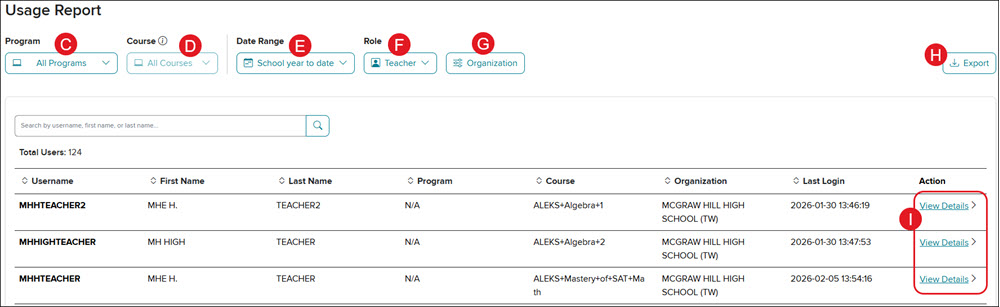
C. Click the All Programs drop-down to select a specific program to view usage data for. Focus the analysis on all or single program for insights. Some ConnectED programs may not show product data.
D. Click the All Courses drop-down to view all courses for the selected program, or data for only certain courses. Analyze multiple courses within a program using the multi-select functionality. Select the checkbox next to the course and click the Apply button at the bottom.
E. Click the Date Range drop-down to toggle between the different Day options, or select a Custom date range. Keep in mind, the longer the date range that is selected, the longer it takes for the report to generate.
F. Toggle between Teacher and Student details by clicking on the Role drop-down.
G. Click the Organization button to select a specific district or school to view.
H. Click the Export button to generate a CSV file of the data.
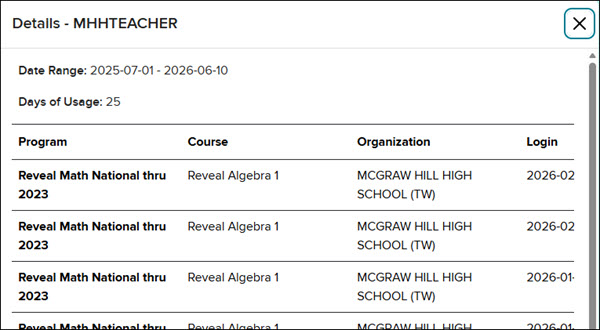
I. Click the View Details link to the right of a user to view the Date Range, Days of Usage, Organization, and Login date and time.
To view additional details about the available Usage Report, view the Access and Navigate the Administrator Dashboard article.
Achieve3000 Literacy Growth and Usage Reports
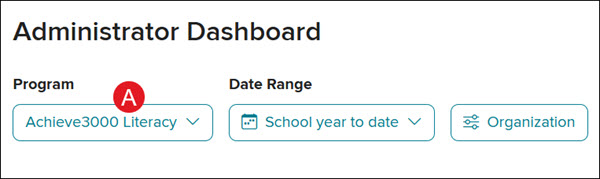
From the Administrator Dashboard, select Achieve3000 Literacy from the Program drop-down (A).
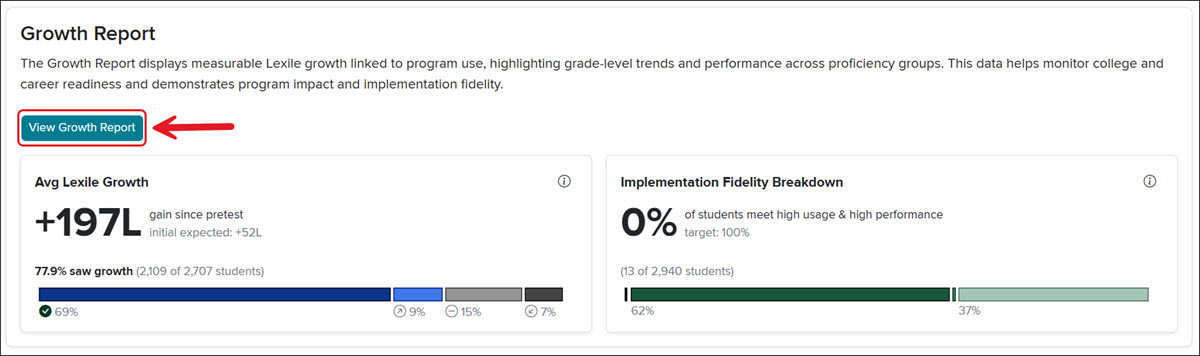
The Growth Report displays measurable Lexile growth linked to program use, highlighting grade-level trends and performance across proficiency groups. This data helps monitor college and career readiness and demonstrates program impact and implementation fidelity. The report is accessible through the Administrator Dashboard.
From the Administrator Dashboard home page, click the View Growth Report button to access additional report data.
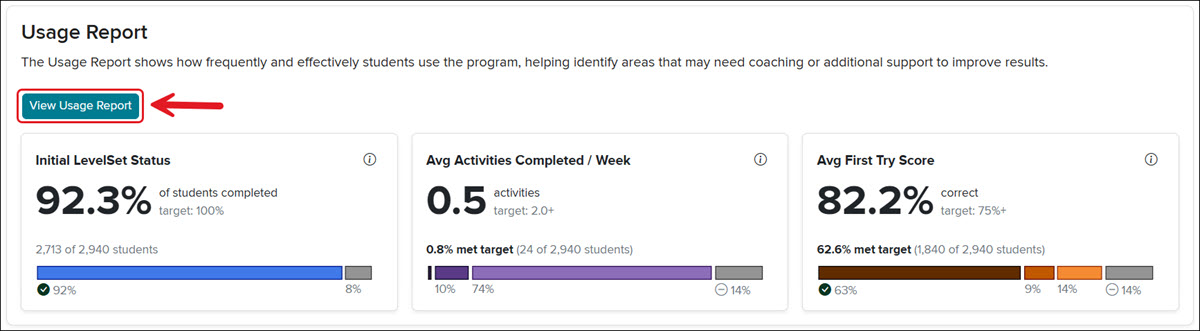
The Usage Report shows how frequently and effectively students use the program, helping identify areas that may need coaching or additional support to improve results.
From the Administrator Dashboard home page, click the View Usage Report button to access additional report data.
To learn more about these reports, take a look at the Achieve3000 Literacy Administrator Growth and Usage Report article.
Personalized Learning Reports
For administrators to be able to access the Personalized Learning report, they must have a Reporting Administrator account. If you have access as an Organization Administrator but do not have access as a Reporting Administrator, refer to the Add Roles to an Existing User article to have the role added to your account. If you only have access as a Curriculum Administrator or Teacher, you will need to reach out to your Organization Administrator to have the role added to your account.
Reporting Administrators have access to Personalized Learning reports for PreK-12 data for students who are using Reveal Math, ALEKS via Open Learning, Redbird, Pearson Review of Progress & Learning (PRoPL), and NWEA MAP Growth assessments. The data is transferred into an interactive Standards and Skills Graph report that aligns the data to state standards and corresponding skills to track proficiency.
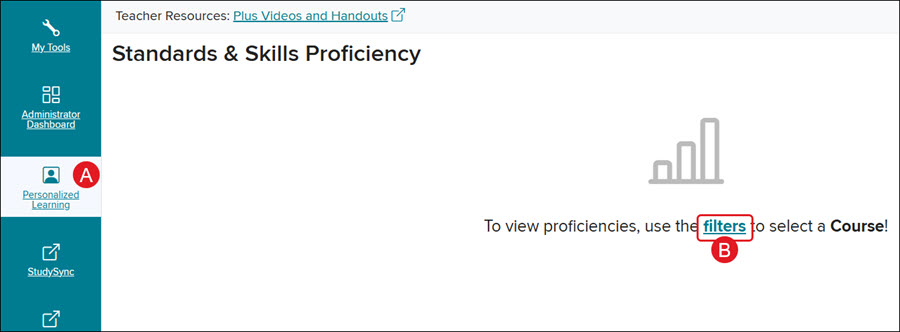
Click on the Personalized Learning (A) option in the left navigation menu of the administrator tools. If you do not see this option, this means that these reports are not enabled for your district. To enable these reports, you'll need to reach out to our PreK-12 Customer Support team.
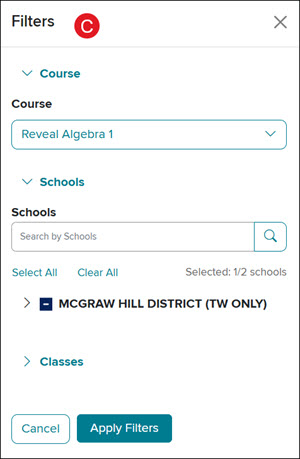
To view the Standards & Skills Proficiency data, you will first need to click on the filters link (B) in the middle of the page and select a Course, Schools, and Classes from the panel.
Graph Breakdown
The Standards and Skills Proficiency graph has four layers of data:
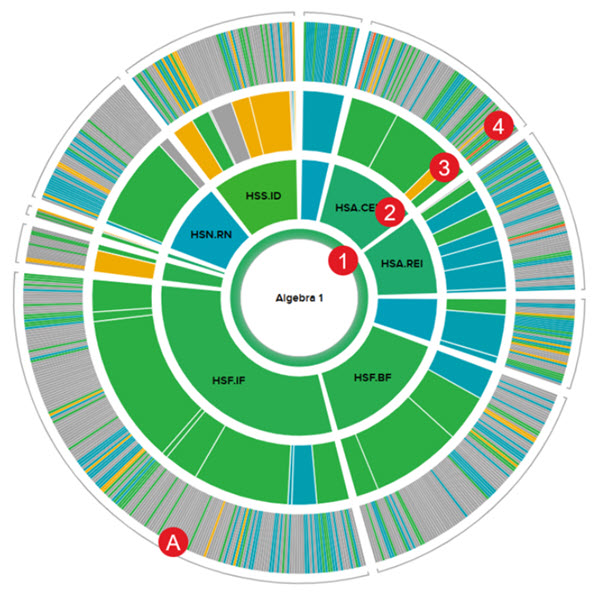
- The first ring represents the RIT scores from the NWEA MAP Growth and Pearson Review of Progress & Learning (PRoPL) assessments.
- NWEA MAP Growth must be enabled for the district before data is populated for this section.
- The second ring also pulls from the NWEA MAP Growth and Pearson Review of Progress & Learning (PRoPL) data and represents the domains.
- Each section within the ring correlates with the standards.
- The size of the domain represents how many of the skills are focused on within that domain and will fluctuate by grade level.
- The third ring represents Reveal Math, ALEKS, Redbird, and Number Worlds data and standards.
- Hover over each section in the domain to view the associated standard.
- The size of the section is determined by the number of skills in that domain-specific to Reveal Math, ALEKS, Redbird, and Number Worlds, and will fluctuate by grade level.
- The fourth ring also pulls from Reveal Math, ALEKS, Redbird, and Number Worlds data and separates each of the standards from the third ring into component skills.
- The fourth ring of the graph only presents data if there are at least five questions answered by the students for a particular skill. The third ring will fill in as data is generated from the skills underneath that standard.
- Additionally, there may be gray-colored (A) areas within the graph. These are areas that have either not collected enough data for the information to be displayed, or they have yet to be covered in the course.
Note: The fourth ring of the graph only presents data if there are at least five questions answered by the students for a particular skill. The third ring will fill in as data is generated from the skills underneath that standard.
To view additional details about the Personalized Learning report, refer to the Personalized Learning Administrator Report article.