Personalized Learning Administrator Report
Access McGraw Hill Plus administrator reports to analyze usage and performance data.
- Supplemental
- Math
- Intervention
- Literacy
- SSO & Manual-Rostering
- Customer Support
- Direct Login & Auto-Rostering
- Number Worlds 2024
- Middle School
- Reports & Analytics
- Core
- ALEKS
- Direct Login & Manual-Rostering
- High School
- CA Reveal Math (K-12)
- SSO & Auto-Rostering
- PreK-12
- School Administrator
- Preschool
- Redbird
- Elementary School
- Personalized Learning Reports
- Reveal Math (K-12)
- McGraw Hill Literacy Emerge!
- McGraw Hill Literacy Summit!
- McGraw Hill Literacy Soar!


This article provides Reporting Administrators with steps and information on accessing the Personalized Learning reports for PreK-12 data for students who are using Reveal Math, ALEKS via Open Learning, Redbird, and NWEA MAP Growth assessments. The data is transferred into an interactive Standards and Skills Graph report that aligns the data to state standards and corresponding skills to track proficiency.
For a full page view of the demo, click here.
For a Spanish version of the demo, click here.
For administrators to be able to access the Personalized Learning report, they must have a Reporting Administrator account. If you have access as an Organization Administrator but do not have access as a Reporting Administrator, refer to Add Roles to an Existing User article to have the role added to your account. If you only have access as a Curriculum Administrator or Teacher, you will need to reach out to your Organization Administrator to have the role added to your account.
Article Contents
Access Personalized Learning Reports
Proficiency Scale, Data Sources, and Labels
Access Personalized Learning Reports
1. SSO or log in at my.mheducation.com.
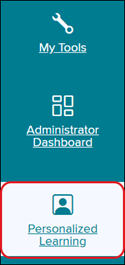
2. Click on Personalized Learning from the navigation menu.
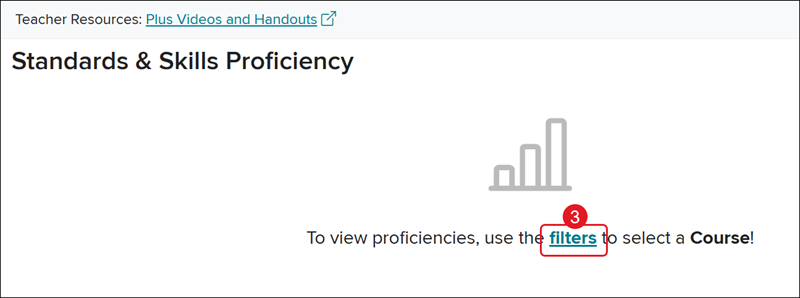
3. Click the Filters link in the center of the page.
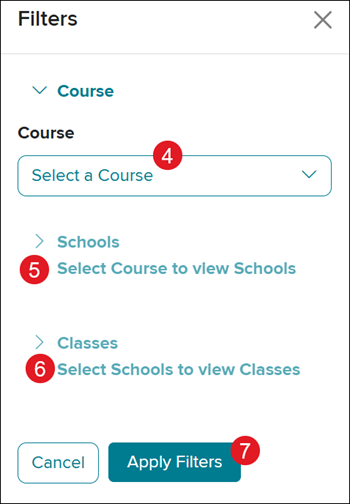
4. On the Filters panel, Select a Course from the drop-down.
5. Select the Schools you want included in the report. More than one school can be in a single report.
6. Select the Classes you want included in the report. More than one class can be in a single report.
7. Click the Apply Filters button.
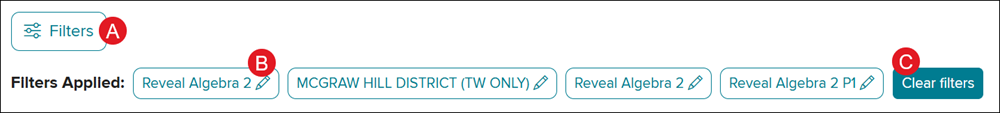
All selected filters will show at the top of the Standards & Skills Proficiency report page.
Click the Filters button (A) or the pencil icon (B) on each listed filter to make changes. Click the Clear filters button (C) to remove all selections.
Graph Breakdown
The Standards and Skills Graph has four layers of data:
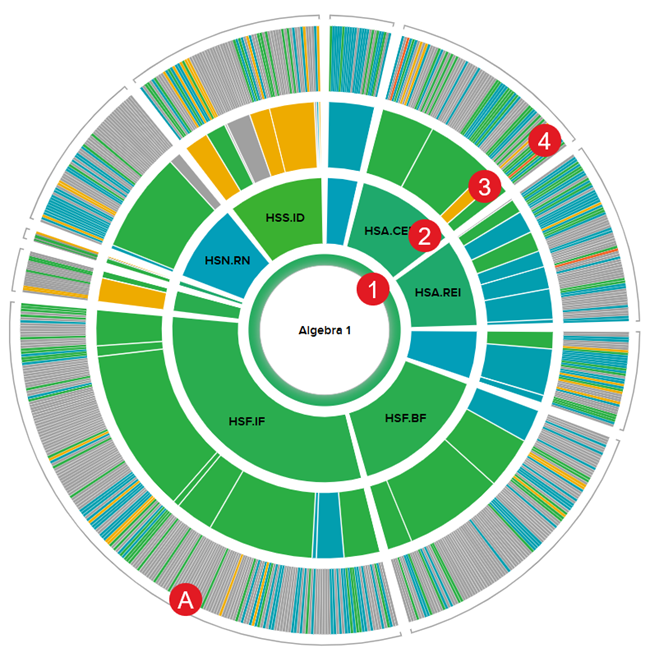
- The first ring represents the RIT scores from the NWEA MAP Growth and Pearson Review of Progress & Learning (PRoPL) assessments.
- NWEA MAP Growth must be enabled for the district before data is populated for this section.
- The second ring also pulls from the NWEA MAP Growth and Pearson Review of Progress & Learning (PRoPL) data and represents the domains.
- Each section within the ring correlates with the standards.
- The size of the domain represents how many of the skills are focused on within that domain and will fluctuate by grade level.
- The third ring represents Reveal Math, ALEKS, Redbird, and Number Worlds data and standards.
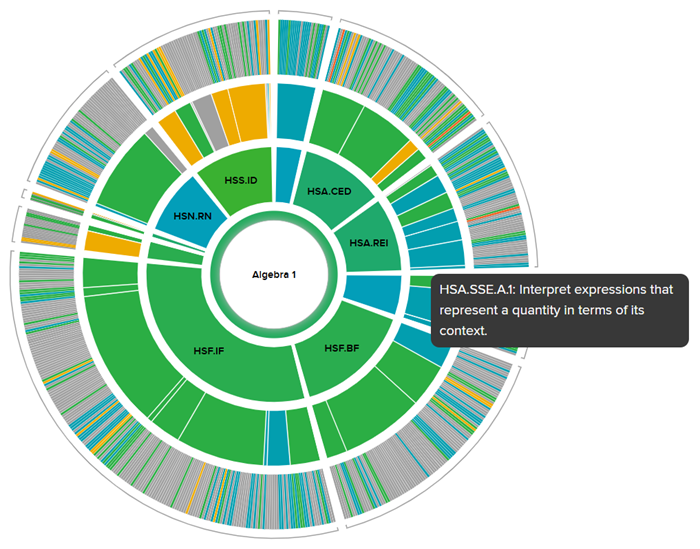
- Hover over each section in the domain to view the associated standard.
- The size of the section is determined by the number of skills in that domain-specific to Reveal Math, ALEKS, Redbird, and Number Worlds, and will fluctuate by grade level.
- The fourth ring also pulls from Reveal Math, ALEKS, Redbird, and Number Worlds, data and separates each of the standards from the third ring into component skills.
- The fourth ring of the graph only presents data if there are at least five questions answered by the students for a particular skill. The third ring will fill in as data is generated from the skills underneath that standard.
- Additionally, there may be gray-colored (A) areas within the graph. These are areas that have either not collected enough data for the information to be displayed, or they have yet to be covered in the course.
Hover over a section in the second and third rings to view the associated standard.
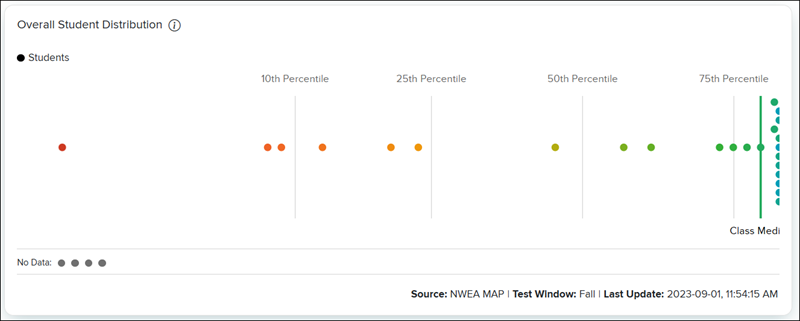
Distribution Panels
The dots in the Overall Student Distribution panel represent each student and the distribution of proficiency in the class. The admin can quickly see where the median of the class performance is, and which students are outliers.
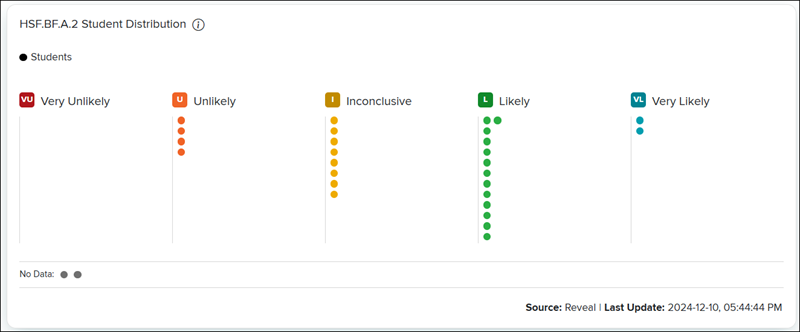
Click on the third ring to view the Student Distribution panel. This represents the probability that the student or classroom is proficient in the standard or skill based on questions answered in ALEKS, Redbird, and/or Reveal.
The data shows the subject and domain proficiencies that are pulled from NWEA MAP Growth for the first and second rings. The panel also shows the expected standard and skill proficiency for the next time students encounter the standards and skills for the third ring.
To view individual student data, click on one of the dots below the sunburst graph in the panel, or by selecting the student’s name from the Students drop-down above the Proficiency Scale panel at the top-right.
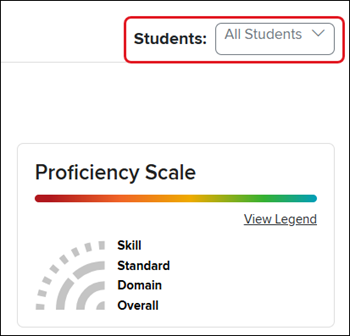
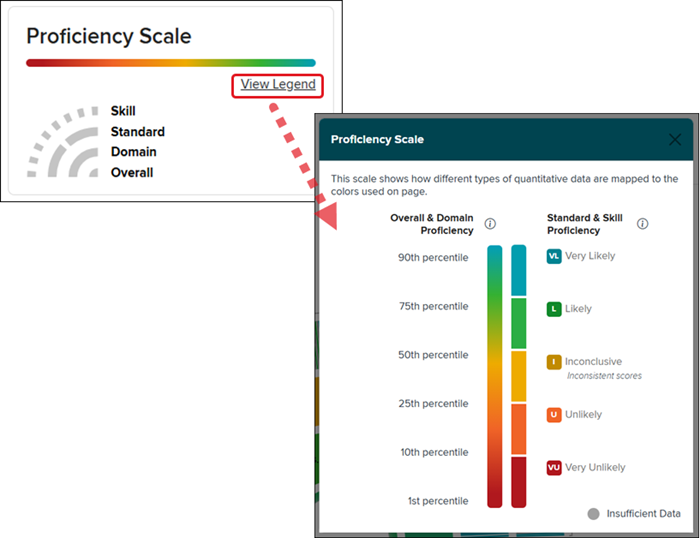
Proficiency Scale, Data Sources, and Labels
Click on the View Legend the in the Proficiency Scale panel located in the top-right corner of the graph to view a color gradation that shows how different types of quantitative data are mapped to the color scale used in the charts.
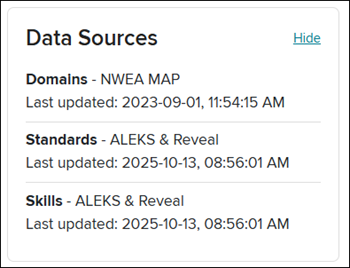
The Data Sources information panel adjusts based on the ring selected.
The grade level label, located at the top-left of the sunburst graph, is a drop-down selector that allows the admins to navigate to a view of proficiencies at other grade levels. It defaults to the grade level tied to the course, however, it allows a notion of longitudinal growth.
The labels also show the admin the grade, domain, and/or standard level they are currently at within the graph. Each label is clickable to easily navigate between the different viewing options available as well as to easily navigate back to a previous view.
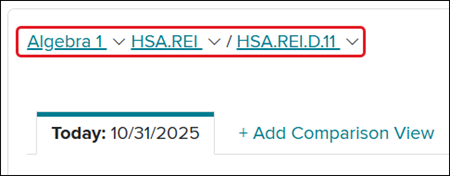
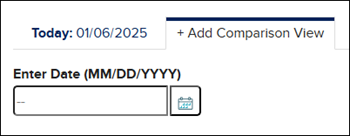
Add Comparison View
There's also the option to add a comparison graph to view the progress from an older date to the current date of data.
Click the +Add Comparison View link and select the Date you want to view. It will take a moment for the data to load. You can then toggle between the two tabs to view the data.
Related Articles:
Updates Completed for McGraw Hill Plus
Implementing Data Integration with Renaissance Star or iReady with McGraw Hill Plus
Implementing the Data Integration with NWEA® Map® Growth™ with McGraw Hill Plus