Achieve3000 Literacy Administrator Growth and Usage Report
Use this report to view measurable gains in Lexile levels and evaluate how students are performing over time.
- PreK-12
- Customer Support
- School Administrator
- Elementary School
- Middle School
- High School
- Direct Login & Auto-Rostering
- Direct Login & Manual-Rostering
- SSO & Auto-Rostering
- SSO & Manual-Rostering
- Supplemental
- Literacy
- Achieve3000 Literacy
- Reports & Analytics


Article Contents
Access the Achieve3000 Literacy Administrator Reports
Access and Navigate the Growth Report
Access and View the Usage Report
Access the Achieve3000 Literacy Administrator Reports
1. SSO or sign in at my.mheducation.com.
You may need to toggle between roles and organizations to get to your administrator tools.
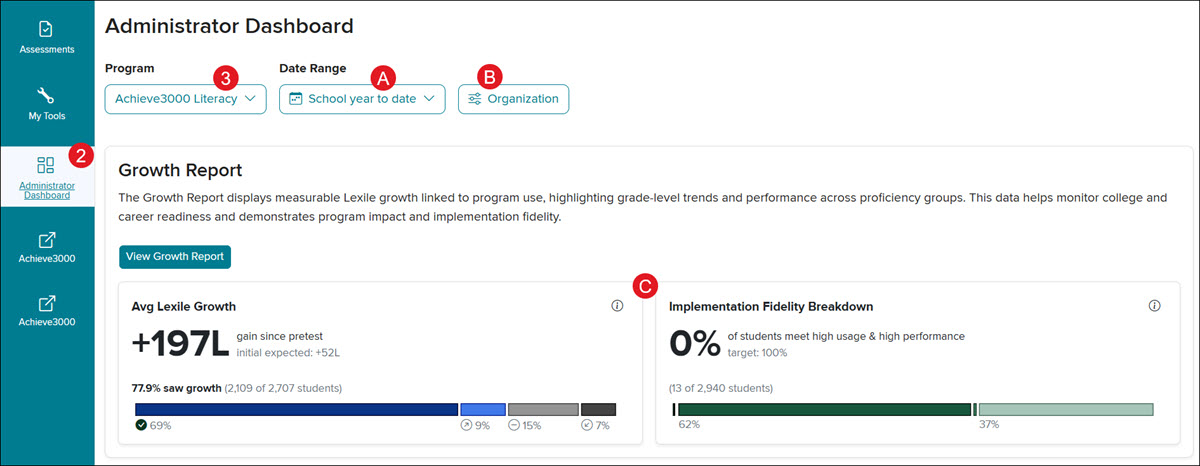
2. Click on Administrator Dashboard from the navigation menu.
3. Select Achieve3000 Literacy from the Program drop-down.
A. Select the Date Range that you would like to view.
B. Click the Organization button to view specific school data.
C. The Avg. Lexile Growth, Implementation Fidelity Breakdown, Initial LevelSet Status, Avg. Activities Completed Per Week, and Average First Try Score data shows on the Administrator Dashboard home page.
These numbers adjust based on the school(s) selected from the Organization filters.
Access and Navigate the Growth Report
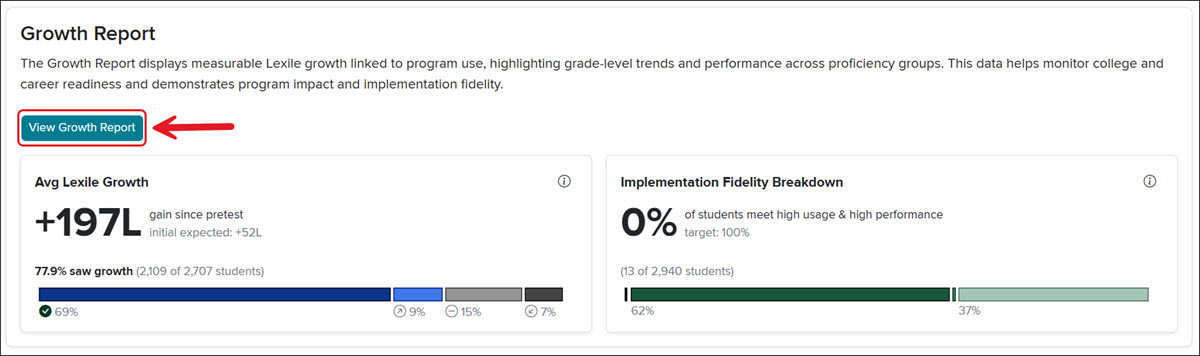
The Growth Report displays measurable Lexile growth linked to program use, highlighting grade-level trends and performance across proficiency groups. This data helps monitor college and career readiness and demonstrates program impact and implementation fidelity. The report is accessible through the Administrator Dashboard.
From the Administrator Dashboard home page, click the View Growth Report button.
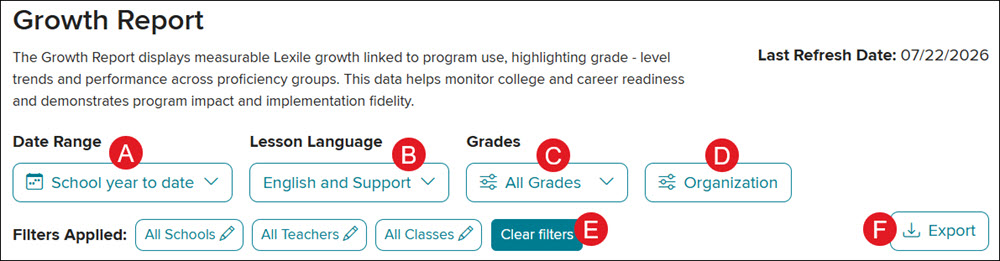
A. The Date Range defaults to School year to date. Click the drop-down to view the Last Day, Last 7 Days, Last 30 Days, Last Academic Year, or a Custom range.
B. The Lesson Language can be toggled between English and Support or Spanish.
C. Select to view all Grades or specific grade levels of data.
D. Click the Organization button to view data for specific Schools, Teachers, and/or Classes.
E. Click the Clear Filters button to remove all selections. It will default the Filters Applied to All Schools, All Teachers, and All Classes.
F. Click the Export button to download a CSV file of the report.
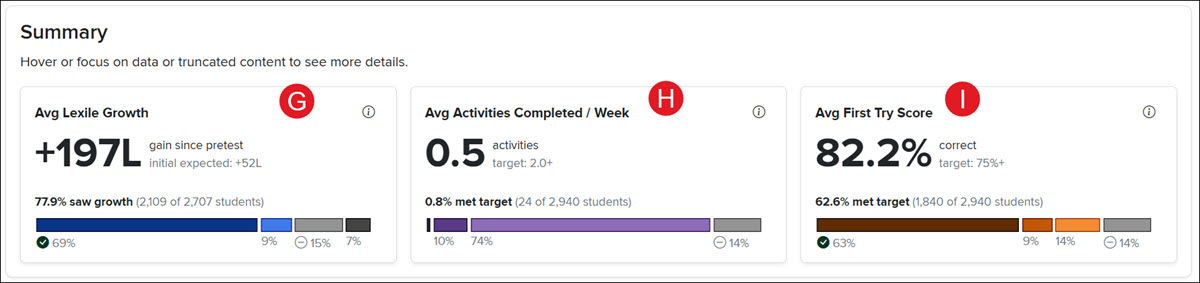
G. The Average Lexile Growth tile shows the average change in Lexile measure for the selected group since the initial assessment.
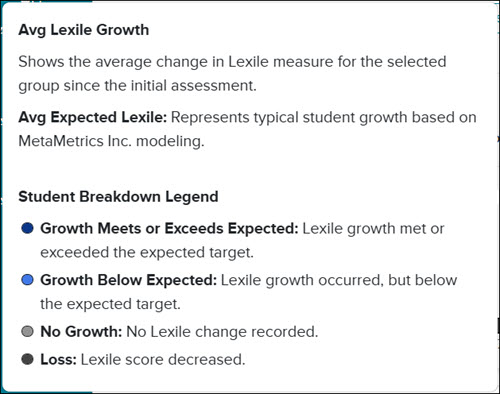
The Average Expected Lexile represents typical student growth based on MetaMetrics Inc. modeling.
Student Breakdown Legend
- Growth Meets or Exceeds Expected: Lexile growth met or exceeded the expected target.
- Growth Below Expected: Lexile growth occurred, but below the expected target.
- No Growth: No Lexile change recorded.
- Loss: Lexile score decreased.
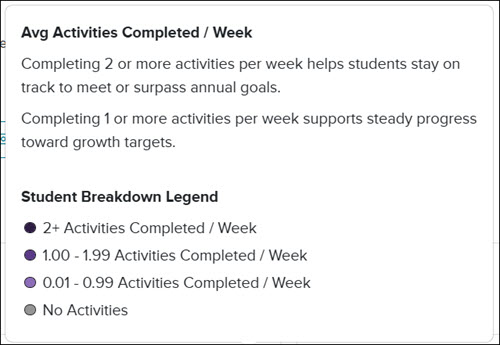
H. The Average Activities Completed/Week tile reflects that completing two or more activities per week helps students stay on track to meet or surpass annual goals. Completing one or more activities per week supports steady progress toward growth targets.
Student Breakdown Legend
- 2+ Activities Completed/Week
- 1.00 - 1.99 Activities Completed/Week
- 0.01 - 0.99 Activities Completed/Week
- No Activities
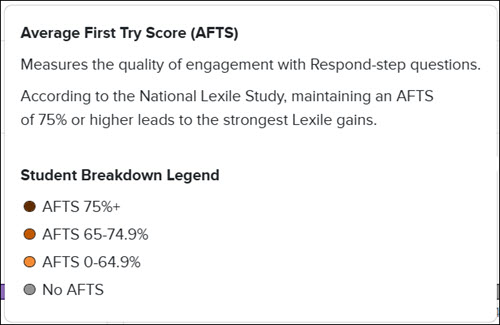
I. The Average First Try Score (AFTS) tile measures the quality of engagement with Respond-step questions. According to the National Lexile Study, maintaining an AFTS of 75% or higher leads to the strongest Lexile gains.
Student Breakdown Legend
- AFTS 75%+
- AFTS 65 - 74.9%
- AFTS 0 - 64.9%
- No AFTS
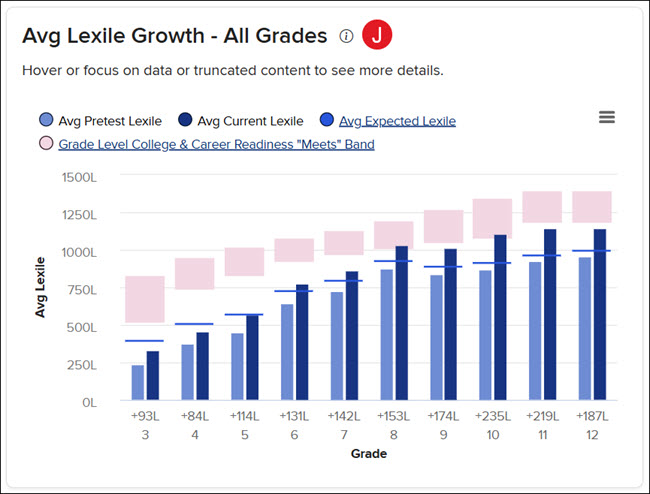
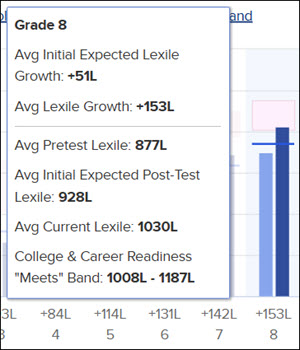
J. The Average Lexile Growth - All Grades chart provides information for the Initial, Current, and Expected End-of-Year Lexile for each grade. You can also compare this data to the College and Career Readiness (CCR) "Meets" band.
Click on a filter to add/remove it from view on the chart. Hover over a filter option to highlight that option on the graph.
For more information, view our National Lexile Study
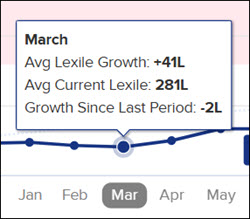
If a single grade level is selected, the tile will show as a line graph.
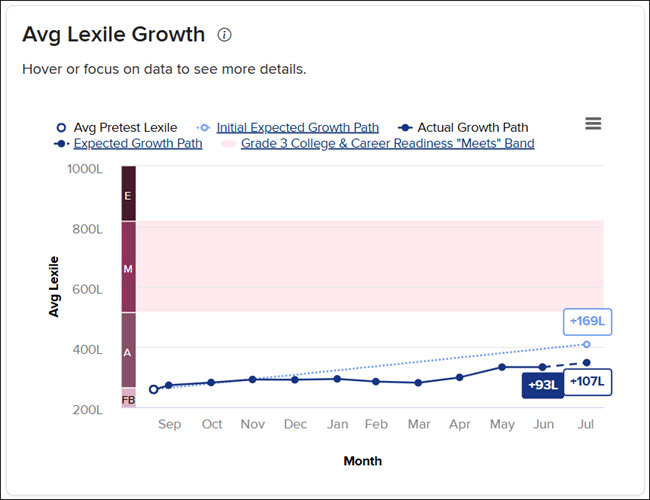
Hover over a bar or dot in the graph to view additional Lexile information for that grade level.
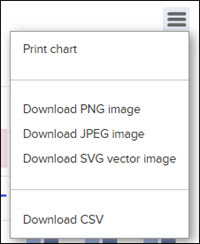
Click on the menu icon to print the chart or download the image or a CSV file.
K. The Implementation Fidelity Breakdown chart can be used to review changes in the quality and quantity of student work month-to-month. This data can be compared to the recommended 2+ activities completed/week, and an Average First Try Score of 75% or higher is recommended for accelerated Lexile growth.
Hover over a filter option to highlight that part of the bar graph.
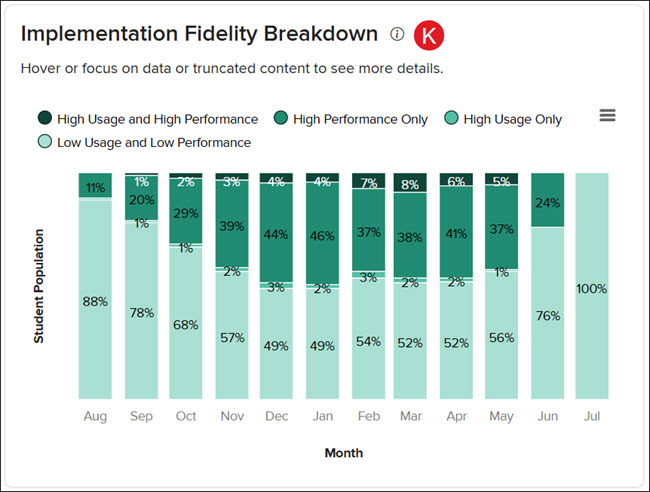
Hover over a bar in the graph to view additional performance and usage information.
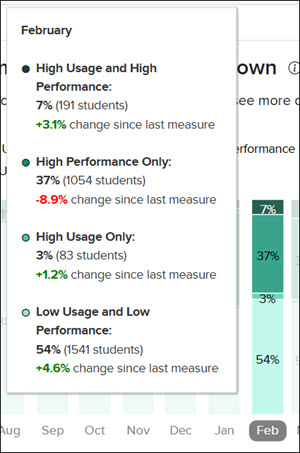
Click on the menu icon to print the chart or download the image or a CSV file.
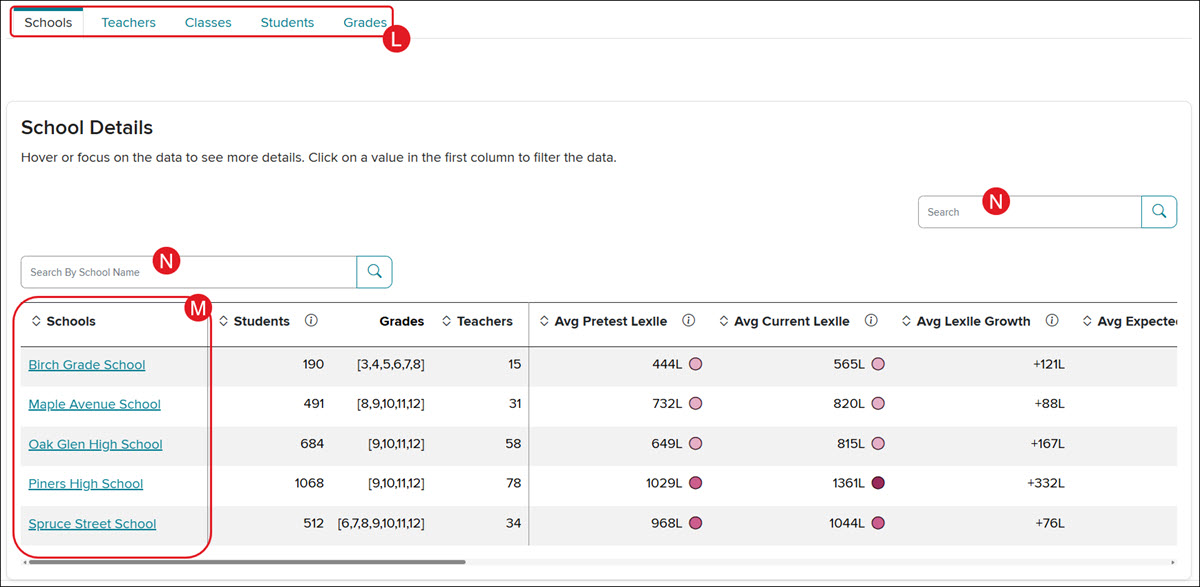
At the bottom of the Growth Report, select a tab to view additional Lexile and performance data by Schools, Teachers, Classes, Students, or Grades (L).
On the Schools, Teachers, or Classes tab, click on a link in the Schools, Teachers, or Classes column (M) to further filter data for that selection.
Data can also be narrowed down by using the Search fields (N).
Click any column header to sort the table rows accordingly.
Access and View the Usage Report
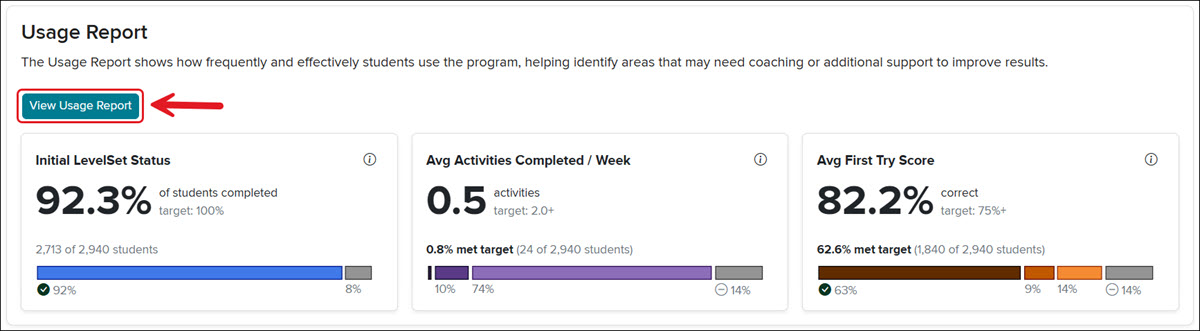
The Usage Report shows how frequently and effectively students use the program, helping identify areas that may need coaching or additional support to improve results.
From the Administrator Dashboard home page, click the View Growth Report button.
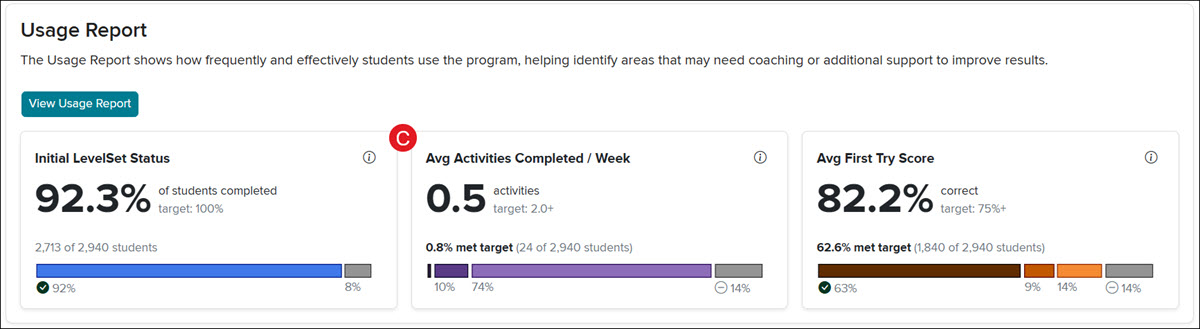
Usage Report Data Shown on the Administrator Dashboard Home Page
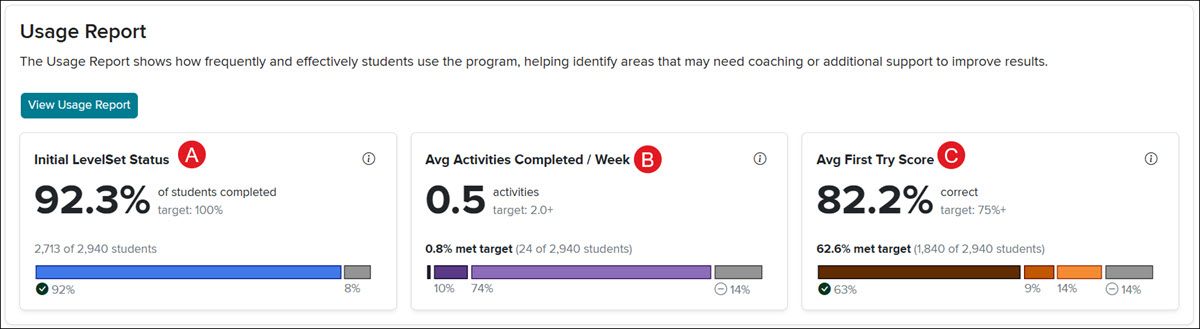
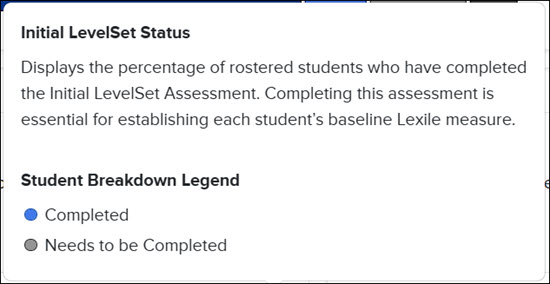
A. The Initial LevelSet Status tile displays the percentage of rostered students who have completed the Initial LevelSet Assessment. Completing this assessment is essential for establishing each student's baseline Lexile measure.
Student Breakdown Legend
- Completed
- Needs to be Completed
B. The Average Activities Completed / Week tile reflects that completing two or more activities per week helps students stay on track to meet or surpass annual goals. Completing one or more activities per week supports steady progress toward growth targets.
Student Breakdown Legend
- 2+ Activities Completed/Week
- 1.00 - 1.99 Activities Completed/Week
- 0.01 - 0.99 Activities Completed/Week
- No Activities
C. The Average First Try Score (AFTS) tile measures the quality of engagement with Respond-step questions. According to the National Lexile Study, maintaining an AFTS of 75% or higher leads to the strongest Lexile gains.
Student Breakdown Legend
- AFTS 75%+
- AFTS 65 - 74.9%
- AFTS 0 - 64.9%
- No AFTS
Navigate the Usage Report
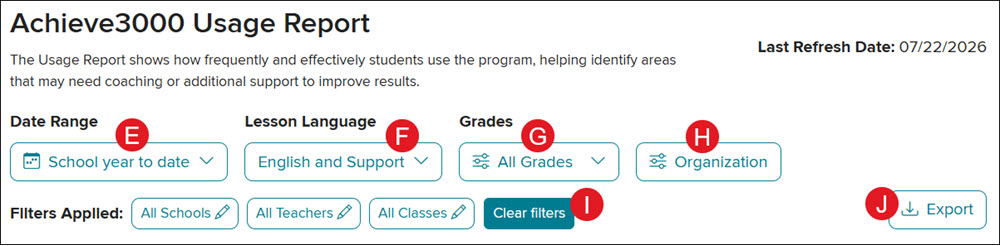
E. The Date Range defaults to School year to date. Click the drop-down to view the Last Day, Last 7 Days, Last 30 Days, Last Academic Year, or a Custom range.
F. The Lesson Language can be toggled between English and Support or Spanish.
G. Select to view all Grades or specific grade levels of data.
H. Click the Organization button to view data for specific Schools, Teachers, and/or Classes.
I. Click the Clear Filters button to remove all selections. It will default the Filters Applied to All Schools, All Teachers, and All Classes.
J. Click the Export button to download a CSV file of the report.
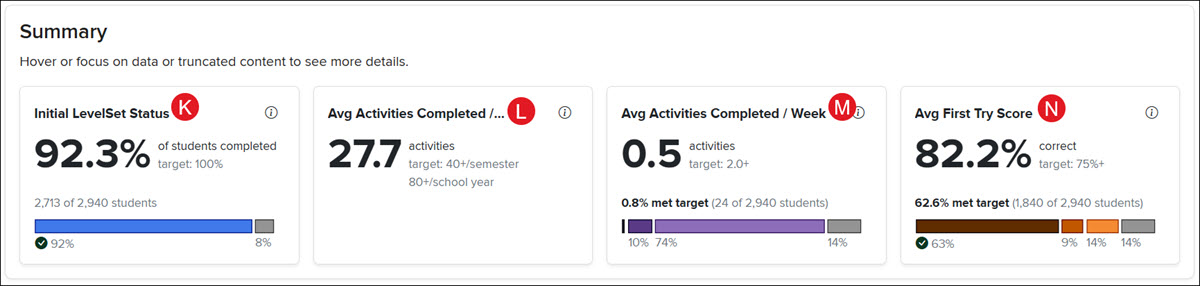
K. The Initial LevelSet Status tile displays the percentage of rostered students who have completed the Initial LevelSet Assessment. Completing this assessment is essential for establishing each student's baseline Lexile measure.
Student Breakdown Legend
- Completed
- Needs to be Completed
L. The Average Activities Completed / Student tile shows the number of activities completed. Completing 80 or more activities in a school year per student helps students stay on track to meet or surpass annual goals. Completing 40 or more activities in a school year per student supports steady progress toward growth targets.
M. The Average Activities Completed / Week tile reflects that completing two or more activities per week helps students stay on track to meet or surpass annual goals. Completing one or more activities per week supports steady progress toward growth targets.
Student Breakdown Legend
- 2+ Activities Completed/Week
- 1.00 - 1.99 Activities Completed/Week
- 0.01 - 0.99 Activities Completed/Week
- No Activities
N. The Average First Try Score (AFTS) tile measures the quality of engagement with Respond-step questions. According to the National Lexile Study, maintaining an AFTS of 75% or higher leads to the strongest Lexile gains.
Student Breakdown Legend
- AFTS 75%+
- AFTS 65 - 74.9%
- AFTS 0 - 64.9%
- No AFTS
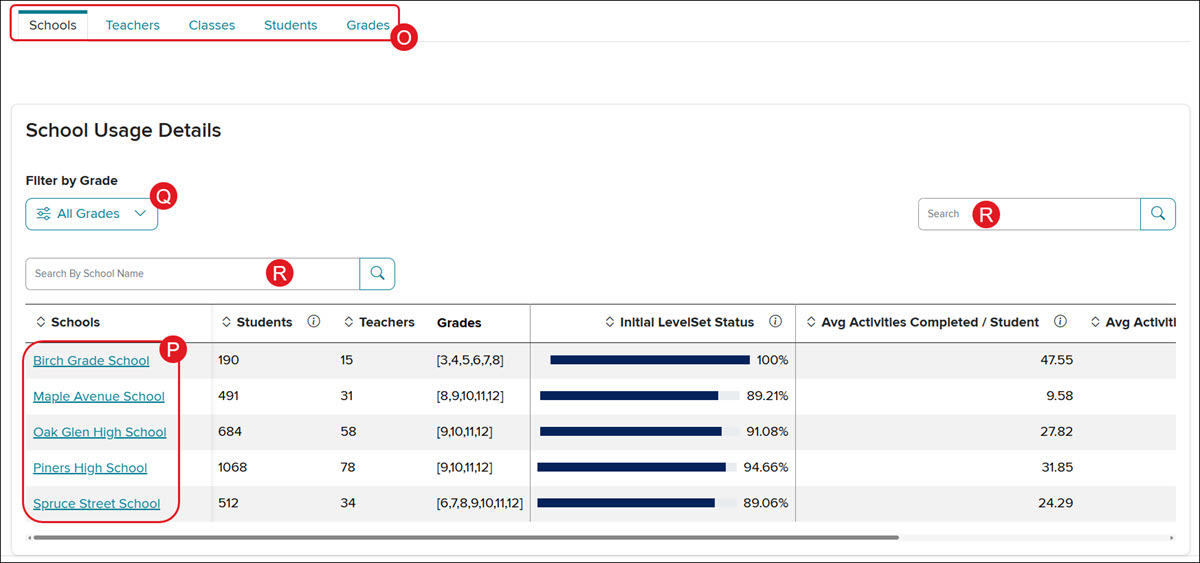
At the bottom of the Usage Report, select a tab to view additional LevelSet and performance data by Schools, Teachers, Classes, Students, or Grades (O).
On the Schools, Teachers, or Classes tab, click on a link in the Schools, Teachers, or Classes column (P) to further filter data for that selection.
Select an option from the Filter by Grade drop-down (Q) to view data for a specific grade or set of grades.
Data can also be narrowed down by using the Search fields (R).
Click any column header to sort the table rows accordingly.