Navigating the Achieve3000 Literacy Administrator Leadership Edition
Instruction on how to access and navigate the Achieve3000 Literacy Leadership Edition as an administrator.
- Customer Support
- PreK-12
- School Administrator
- Elementary School
- Middle School
- High School
- Direct Login & Auto-Rostering
- Direct Login & Manual-Rostering
- SSO & Auto-Rostering
- SSO & Manual-Rostering
- Supplemental
- Literacy
- Achieve3000 Literacy
- Dashboard & Navigation Overview
- Reports & Analytics


Article Contents
Overview
For Administrators, the Leadership Edition provides timely information at-a-glance that allows each group to monitor the health of their Acheive3000 Literacy solution implementation. Use that information to intervene as necessary, and quickly assess and communicate program effectiveness.
Note: The Leadership Edition only shows aggregated trend data and comparisons. The data does not include the names of individual students.
There are four components to the Leadership Edition's At a Glance dashboard:
- On-demand filters
- Ribbon of key metrics
- A comparison chart
- A trend chart
Using these components, administrators can measure the district's or school's current status relative to the previous status. Filter the data by the levels of the organization and by date range. Disaggregate by school, grade level, teacher, or class. Administrators can also disaggregate any metric by time - day, week, or month.
Access Leadership Edition
1. Sign into your Administrator account on my.mheducation.com.
If you have both a Teacher and an Administrator account, you will need to toggle over to your Administrator account. For steps on moving between profiles, refer to the Access Your Administrator Account article.
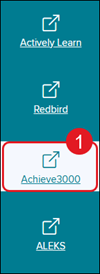
2. Click on Achieve3000 from the navigation menu.
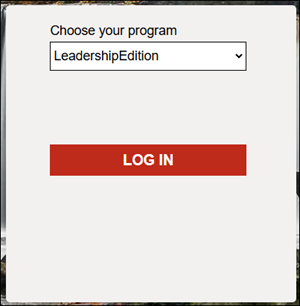
3. Click the Choose your program drop-down and select LeadershipEdition.
4. Click the Log In button.
Leadership Edition Navigation
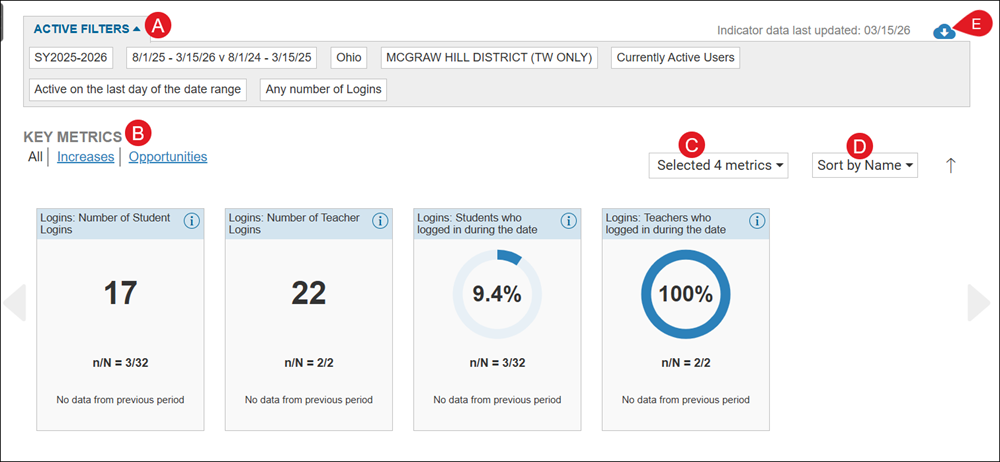
A. Click Active Filters to view the list of filters that are currently selected.
B. Click to view All, Increases, or Opportunities Key Metrics.
C. Click the drop-down to select the metrics to view in the report.
D. Click the Sort by drop-down to view by Name, by Value, or by % (percent) Change.
E. Click the Download button to save/print the current report view.
Comparisons by Category
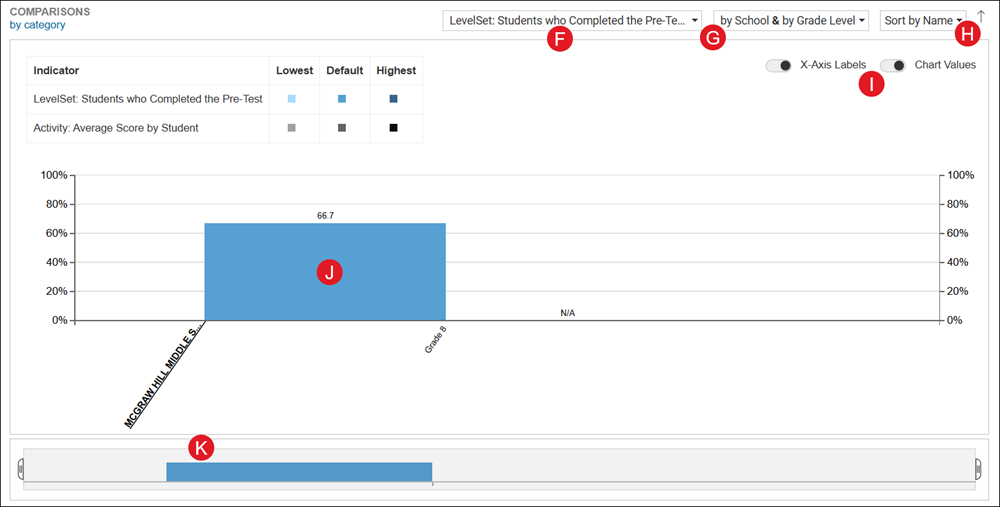
F. Click on the category drop-down to select up to five options to view within the bar graph.
G. Click the middle drop-down to filter by School, by Grade Level, by Teacher, and/or by Class. You can select up to two options.
H. Click the Sort by drop-down to filter by Name, by LevelSet, or by Activity/Logins/CCR/Lexiles.
Note: The options available in this drop-down will vary based on the selections made in the first drop-down (F).
I. Toggle on/off to view the X-Axis Labels and Chart Values.
J. Click on a bar in the graph to view additional details.
K. If there is a lot of data available based on the options selected, a red box will show on the smaller bar graph. Click on it to scroll through the view on the larger graph view.
Trends Change Over Time
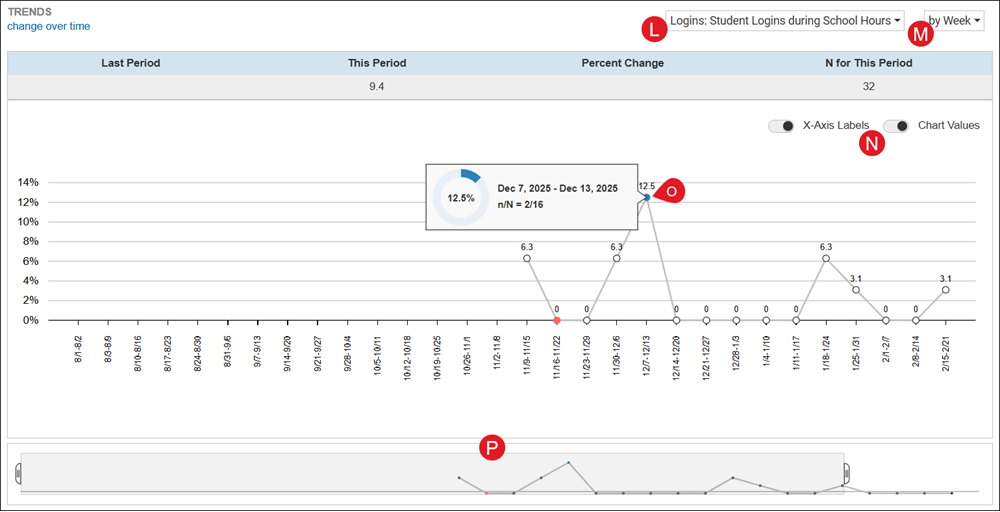
L. Click the first drop-down to select what to view in the graph.
M. Click the Sort by drop-down to view by Day, by Week, or by Month.
N. Toggle on/off to view the X-Axis Labels and Chart Values.
O. Click a point on the graph to view additional details.
P. If there is a lot of data available based on the options selected, a red box will show on the smaller bar graph. Click on it to scroll through the view on the larger graph view.
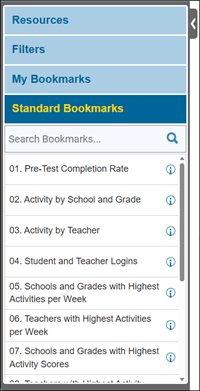
Filters
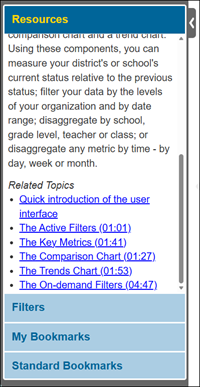
The Resources section provides an overview of the Leadership Edition report. It also provides a list of Related Topics with links to videos for different parts of the report.
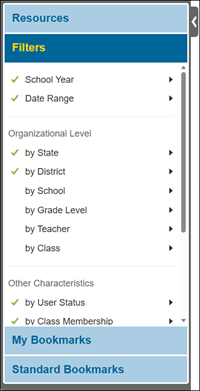
The Filters section is where you can select what metrics to view within the report.
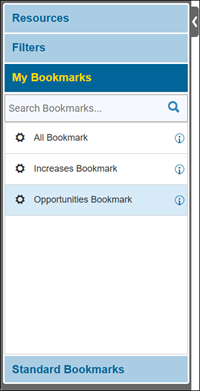
The My Bookmarks section contains all bookmarks you have created within the report page.
The Standard Bookmarks are premade bookmarks that can be selected to view different metrics within the report.
My Bookmarks
Administrators can create their own bookmarks to easily navigate from one report view to another.
1. Select preferred filter options.
2. Click Bookmark at the top-right of the page.
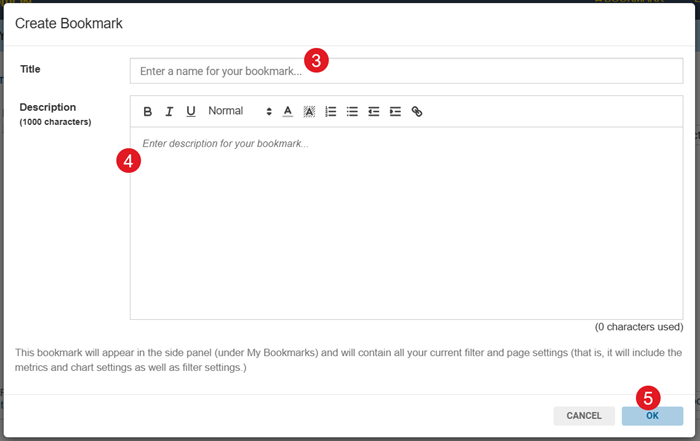
3. On the pop-up, enter a Title.
4. Enter a Description.
5. Click the OK button.
The bookmark will be listed under the My Bookmarks filter section.
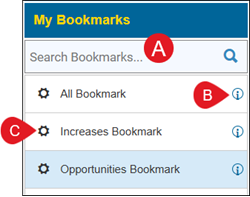
A. Use the Search Bookmarks field to locate a specific bookmark.
B. Click the information icon to view the description entered for the bookmark.
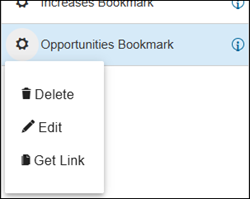
C. Click the gear icon to Delete, Edit, or copy a Link for the bookmark.
Leadership Edition FAQ
What’s the difference between Leadership Edition and the reports in Achieve3000 Literacy?
Leadership Edition provides an overview of data for School and District Admins, but does not provide information that drills down to the individual student level. That information is only available through the reports in Achieve3000 Literacy.
Can teachers use the Leadership Edition?
The Leadership Edition is only available to those with Admin level accounts. If any teacher needs access, they will need to have a secondary account created with Admin-level access.
How do I log into the Leadership Edition?
You will use the same method to log in that you use to access Achieve3000 Literacy. On the login page, when it asks “Which program?” choose “Leadership Edition” from the drop-down menu.
Can I export data from the Leadership Edition?
Yes! You can export data into Excel, PDF, images, or PowerPoint slide formats. Simply click on the icon at the top right that looks like a cloud with an arrow pointing down to view options and make your selections.
How is this information calculated?
If you click on the “i” icon next to any Bookmark or metric displayed on the page, you will find an explanation regarding how the information is calculated as well as how the information provided can be useful in assessing data and guiding instruction.
Why don’t I see a certain school/class listed in the data?
If there has been no usage at a school site or class during the date range that's set in the filters, the school/class will not show in Leadership Edition.