


 79 / 121

70
60
50
40
30
20
10
2400
2200
2000
1800
1600
1400
1200
1000
800
600
400
200
0
1960
1955
1970
1980
1990
2000
2010
1965
1975
1985
1995
2005
2015
Number of Wolves
Number of Moose
Year
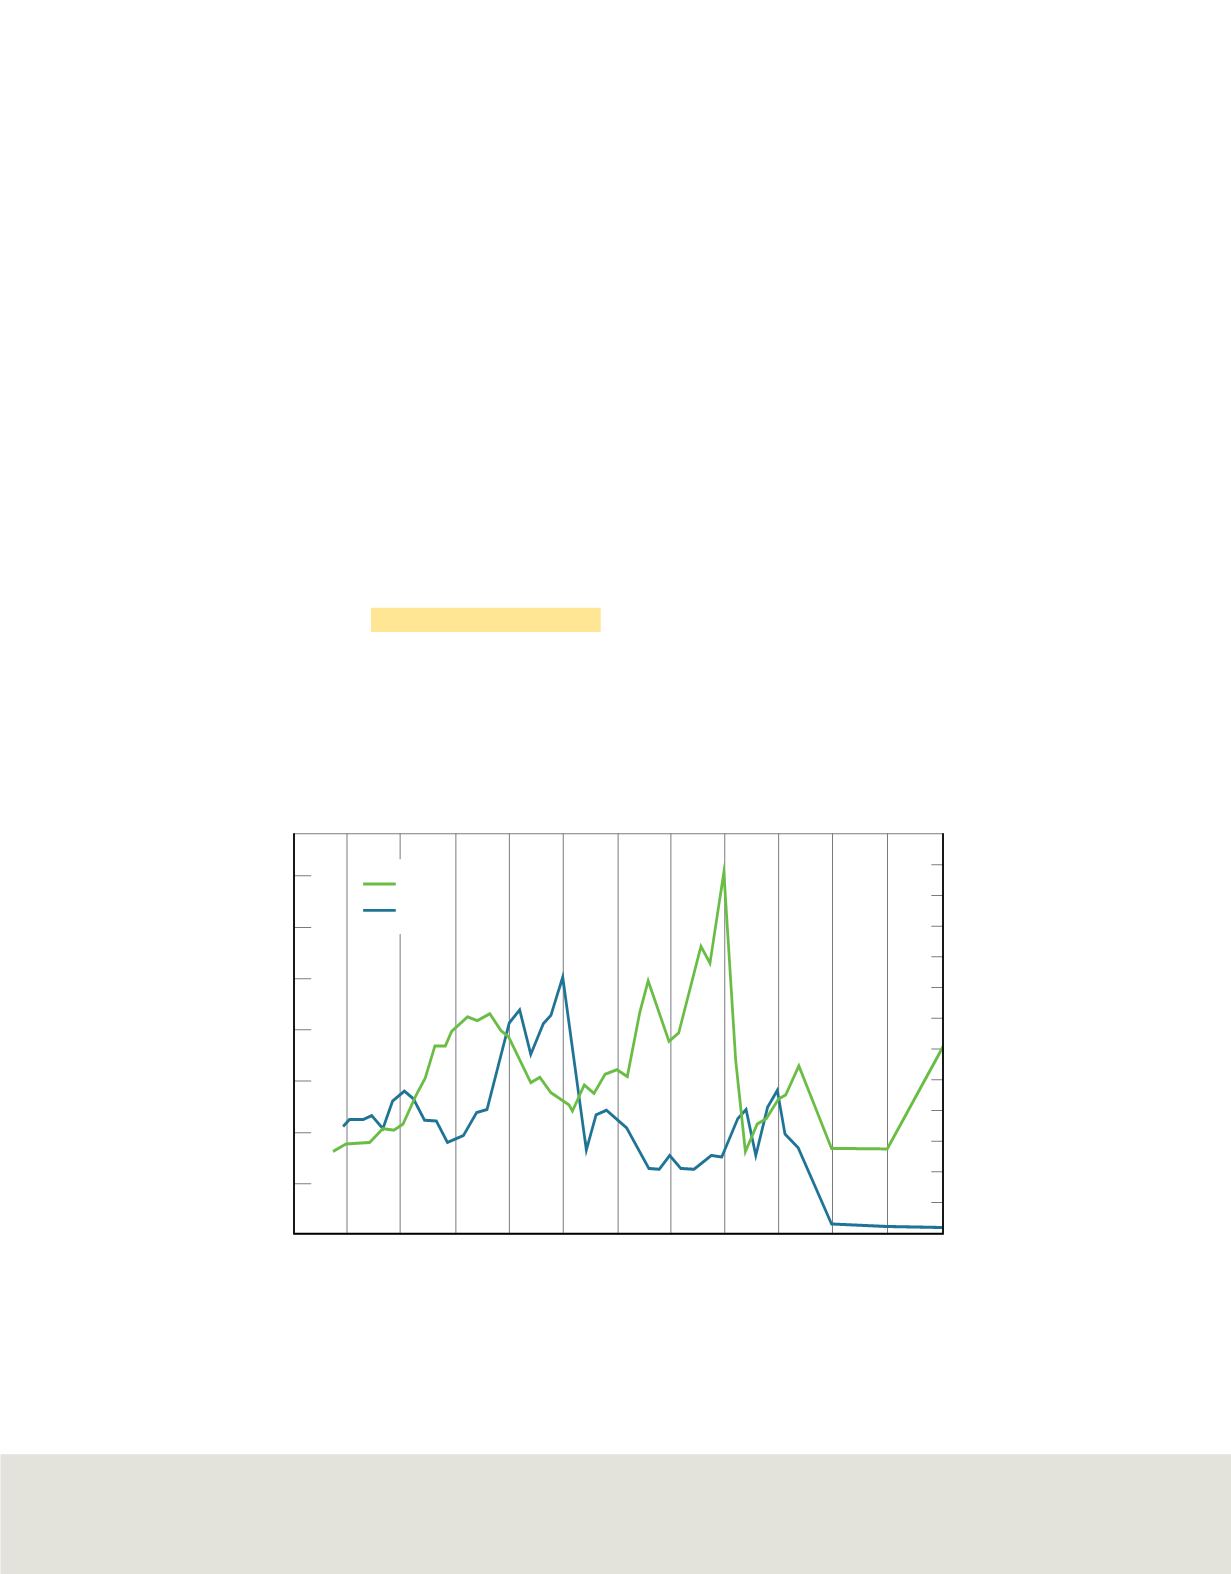
Isle Royal Case Study
Moose
Wolves
Figure 4
on the last page shows an example of the effects that fire can have on a popula-
tion. The ponderosa pines have been damaged by a crown fire, a fire that advances to
the tops of the trees. In this example, the fire limits the population of ponderosa trees
by killing many of the trees. However, smaller but more frequent ground fires have the
opposite effect on the population. By thinning lower growing plants that use up nutri-
ents, a healthier population of mature ponderosa pines is produced.
Populations can be limited by the results of human interference. For example, over the
last 100 years, building dams and other human activities on the Colorado River have
significantly reduced the river’s water flow and changed its temperature. In addition,
the introduction of nonnative fish species altered the river’s biotic factors. Because of
the changes in the river, the number of small fish called humpback chub was reduced.
During the 1960s, the number of humpback chub dropped so low that they were in
danger of disappearing from the Colorado River altogether. Air, land, and water pollu-
tion are the result of human activities that also can limit populations. Pollution reduces
the available resources by making some of the resources toxic.
Density-dependent factors
Any factor in the environment that depends on the number of members in a population
per unit area is a
density-dependent factor.
Density-dependent factors are often biotic
factors such as predation, disease, competition, and parasites.
Predation
A study of density-dependent factors was done on the wolf and moose
populations in northern Michigan on Isle Royale, located in Lake Superior. The
results of this study are shown in
Figure 5
.
Figure 5
The long-term study of the wolf and moose populations on Isle Royale shows the
relationship between the number of predators and prey over time.
Infer
what might have caused the increase in the number of moose between 1990 and 1995.
Lesson 1 • Population Dynamics
81