


 85 / 121

Percent Increase in Human Population
Percent increase
Year
1950 1975 2000 2025 2050
2.2
2.0
1.8
1.6
1.4
1.2
1.0
0.8
0.6
0.4
0.2
0
2016
Notice
Figure 11
on the last page shows a relatively stable number of individuals over
thousands of years—until recently. Notice also the recovery of the human population
after the outbreak of the bubonic plague in the 1300s when an estimated one-third of the
population of Europe died. Perhaps the most significant feature in this graph is the
increase in the population in recent times. In 1804, the population of Earth was an
estimated one billion people. Earth reached a milestone in 2011, when our population
was recorded at seven billion people. With the current growth rate at just over 83 million
people per year we are expected to reach a population of 9.8 billion by 2050.
Technological advances
For thousands of years, environmental conditions kept the size of the human population
at a relatively constant number below the environment’s carrying capacity. More
recently, however, humans have altered the environment in ways that appear to have
changed its carrying capacity. Agriculture and domestication of animals have increased
the human food supply. Technological advances and medicine have improved the
chances of human survival by reducing the number of deaths from parasites and disease.
In addition, improvements in shelter have made humans less vulnerable to climatic
impacts.
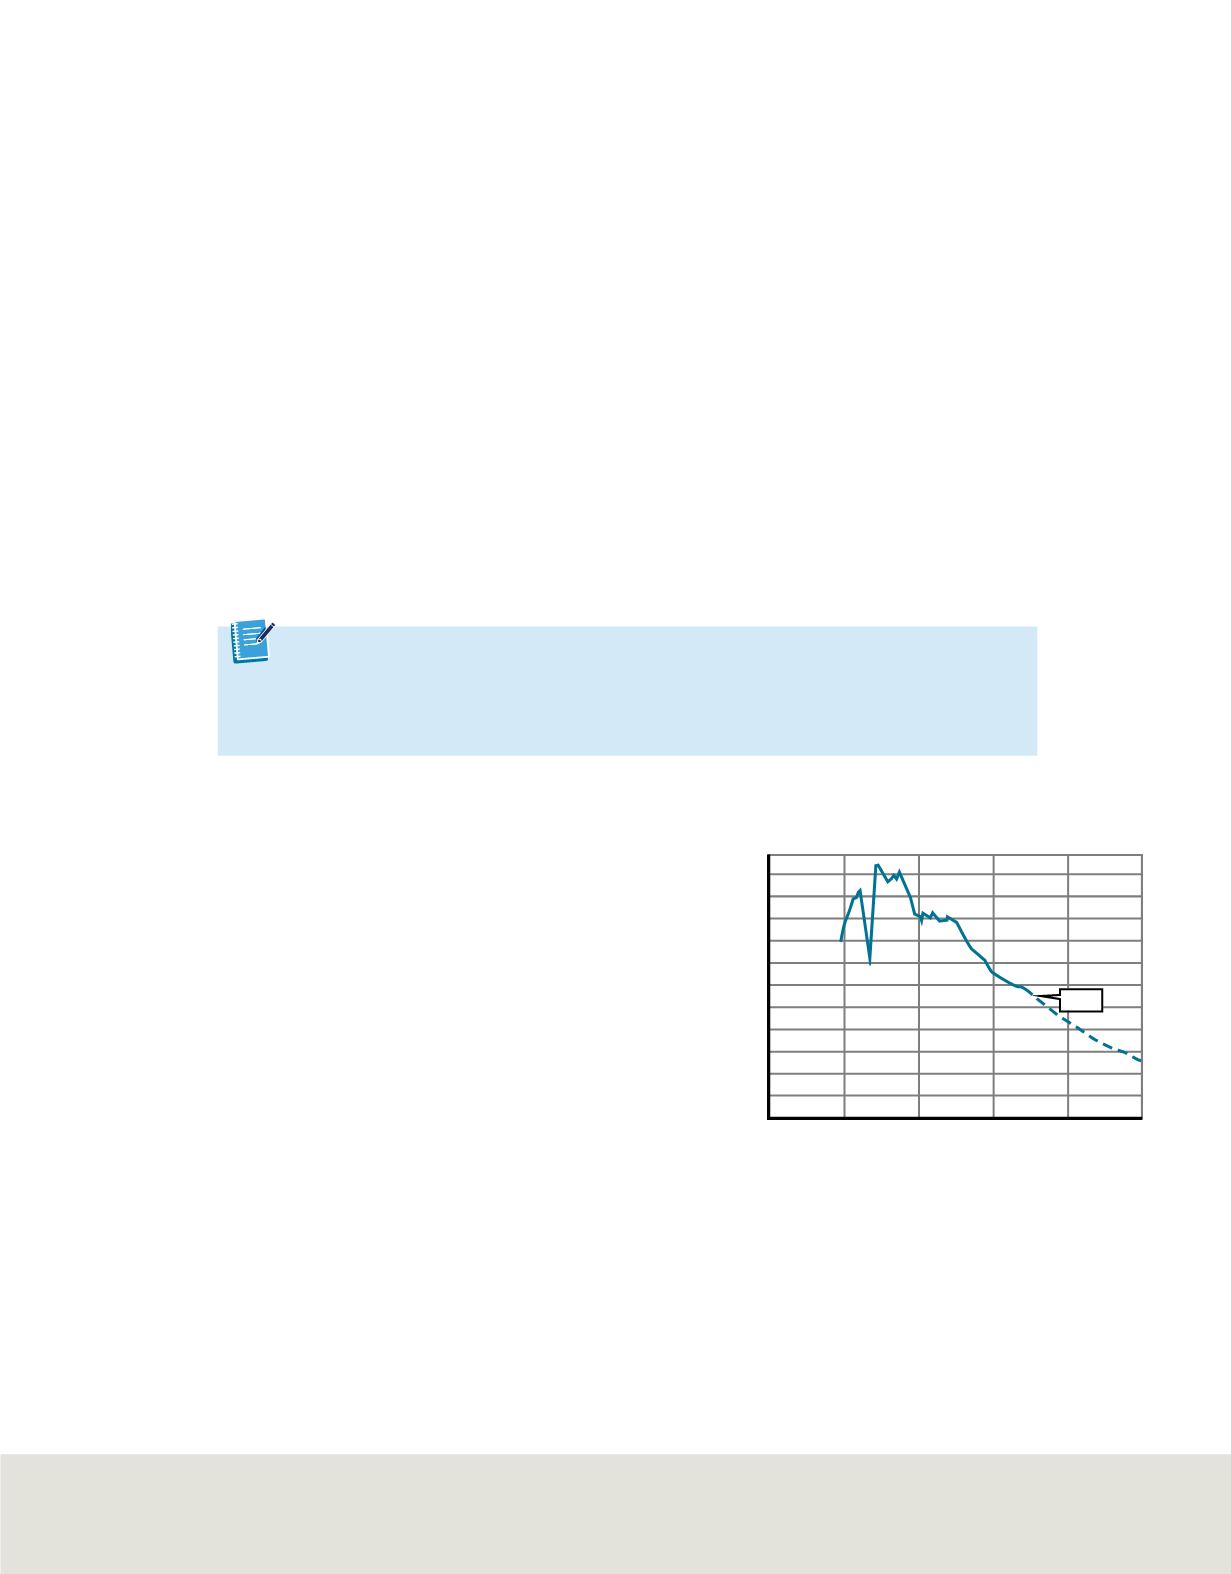
Figure 12
This graph shows the percent increase in the
global human population using data from the late 1940s
through 2016 and the projected percent increase to 2050.
Determine
the approximate population increase in the year
2025.
Human population growth rate
Although the human population is still growing,
the rate of its growth has slowed.
Figure 12
shows the percent increase in human population
from the late 1940s through 2016. The graph
also includes the projected population increase
through 2050.
Notice the sharp dip in human population
growth in the 1960s. This was due primarily to a
famine in China in which about 60 million
people died. The graph also shows that human
population growth reached its peak at over 2.2
percent in 1963. By 2016, the percent increase in
human population growth had dropped to less
than 1.2 percent.
Population models predict the overall population
growth rate to be below 0.6 percent by 2050.
The decline in human population growth is due
primarily to diseases such as AIDS and volun-
tary population control.
Get It?
Explain
the factors that have contributed to an increase in the survival rate of the
human population. Have these factors contributed to the homeostasis of the
population within its enviroment? Explain.
Lesson 2 • Human Population
87