


 116 / 123

C06_017A
Li
76
Na
102
K
138
Rb
152
Cs
167
Be
31
Mg
72
Ca
100
Sr
118
Ba
135
B
20
Al
54
Ga
62
n
81
Tl
95
C
15
Si
41
Ge
53
Sn
71
Pb
84
N
146
P
212
As
222
Sb
62
Bi
74
O
140
S
184
Se
198
Te
221
F
133
Cl
181
Br
196
220
K
138
1
+
1
Chemical symbol
Charge
Relative size
Ionic radius
2
3
4
5
6
1
+
1
+
1
+
1
+
1
+
2
Period
13
14
15
16
17
2
+
2
+
2
+
2
+
2
+
3
+
3
+
3
+
3
+
3
+
4
+
4
+
4
+
4
+
4
+
3
3
3
5
+
5
+
2
2
2
2
1
1
1
1
C06_018A
Trends in Ionic Radii
Positive ions decrease
Negative
ions
decrease
Generally increases
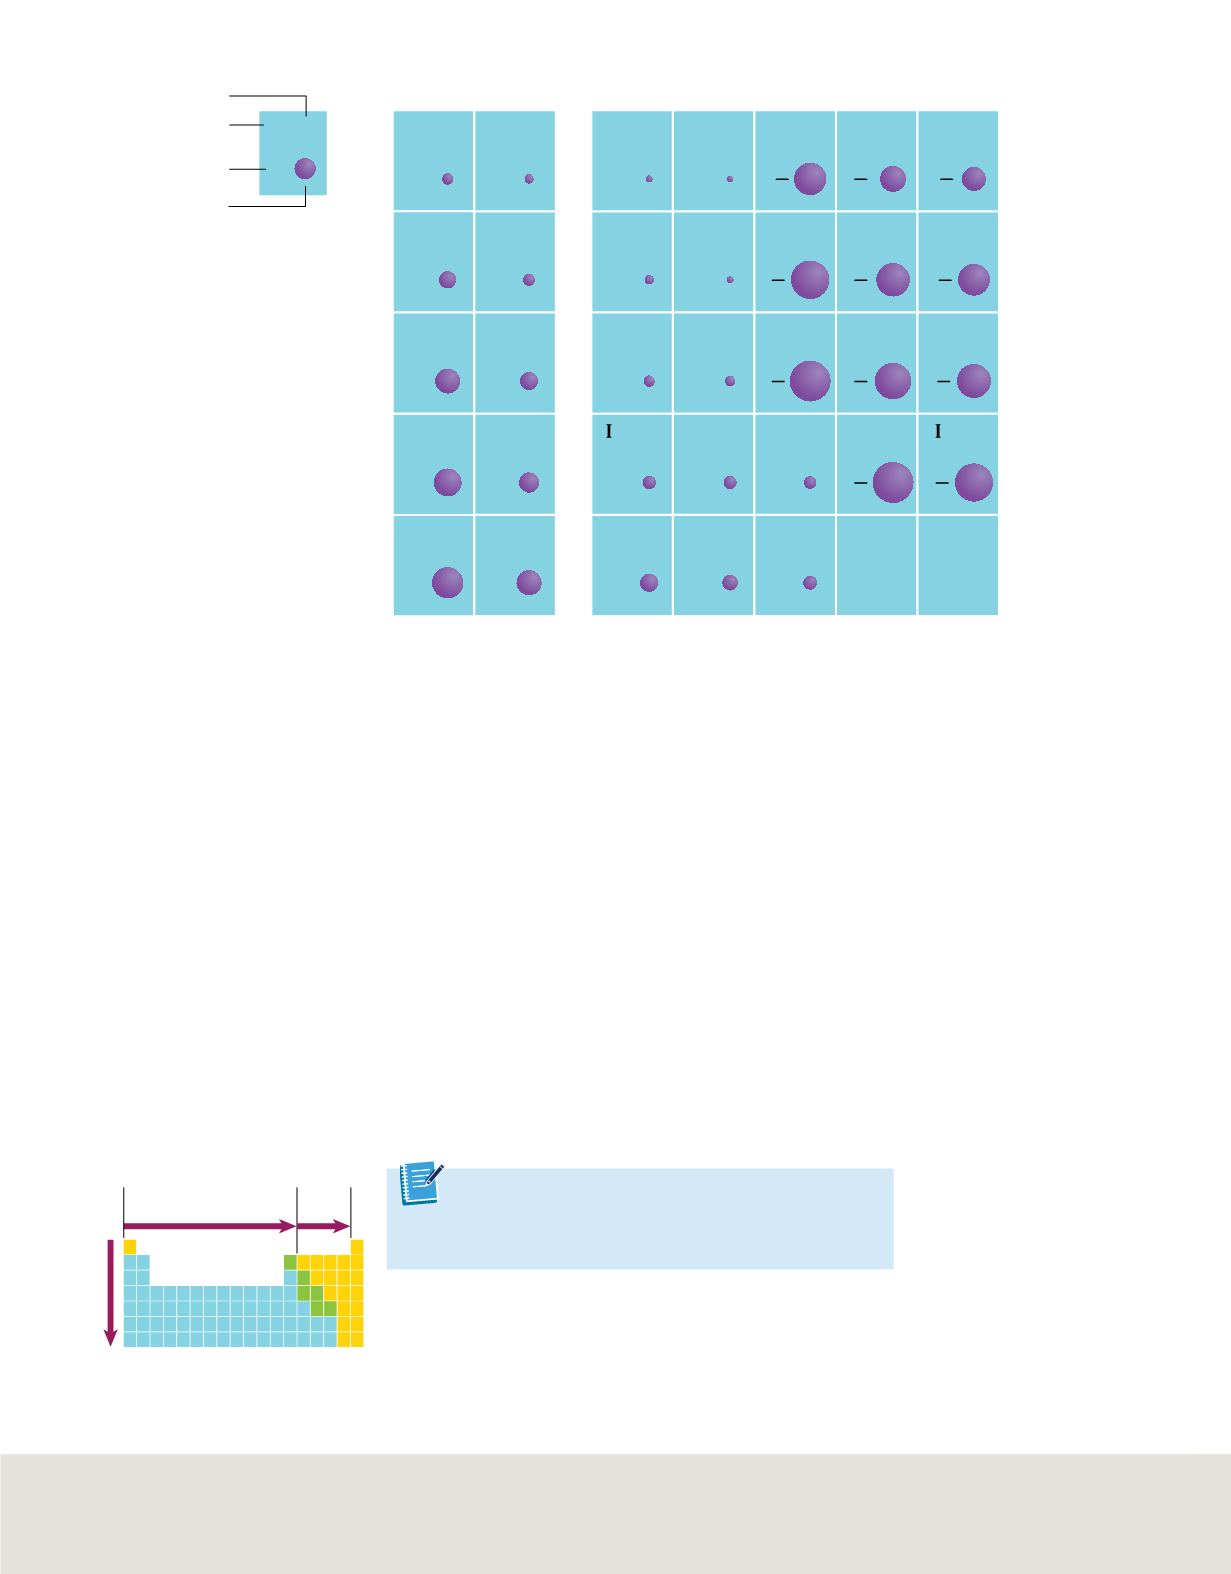
Figure 15
The ionic radii of most of the representative elements are shown in picometers (10
−12
m).
Explain
why the ionic radii increase for both positive and negative ions as you move down a group.
Figure 16
The diagram summarizes the general trends in
ionic radii.
Get It?
Explain
why calcium has a greater atomic radius
than magnesium.
Trends within periods
The ionic radii of most of the representative elements are shown in
Figure 15
. Note that
elements on the left side of the table form smaller positive ions, and elements on the
right side of the table form larger negative ions.
In general, as you move from left to right across a period, the size of the positive ions
gradually decreases. Then, beginning in group 15 or 16, the size of the much-larger
negative ions also gradually decreases.
Trends within groups
As you move down a group, an ion’s outer electrons are in orbitals corresponding to
higher principal energy levels, resulting in a gradual increase in ionic size. Thus, the
ionic radii of both positive and negative ions increase as you move down a group. The
group and period trends in ionic radii are summarized in
Figure 16
.
156
Module 5 • The Periodic Table and Periodic Law