


 93 / 121

House Finches and
Mycoplasma
gallisepticum
Infection
0
1
2
3
5
4
6
House finch index
Years after infection rate
reached 20 percent
0
1
2
3
1995
1994
1996
blickwinkel/Alamy
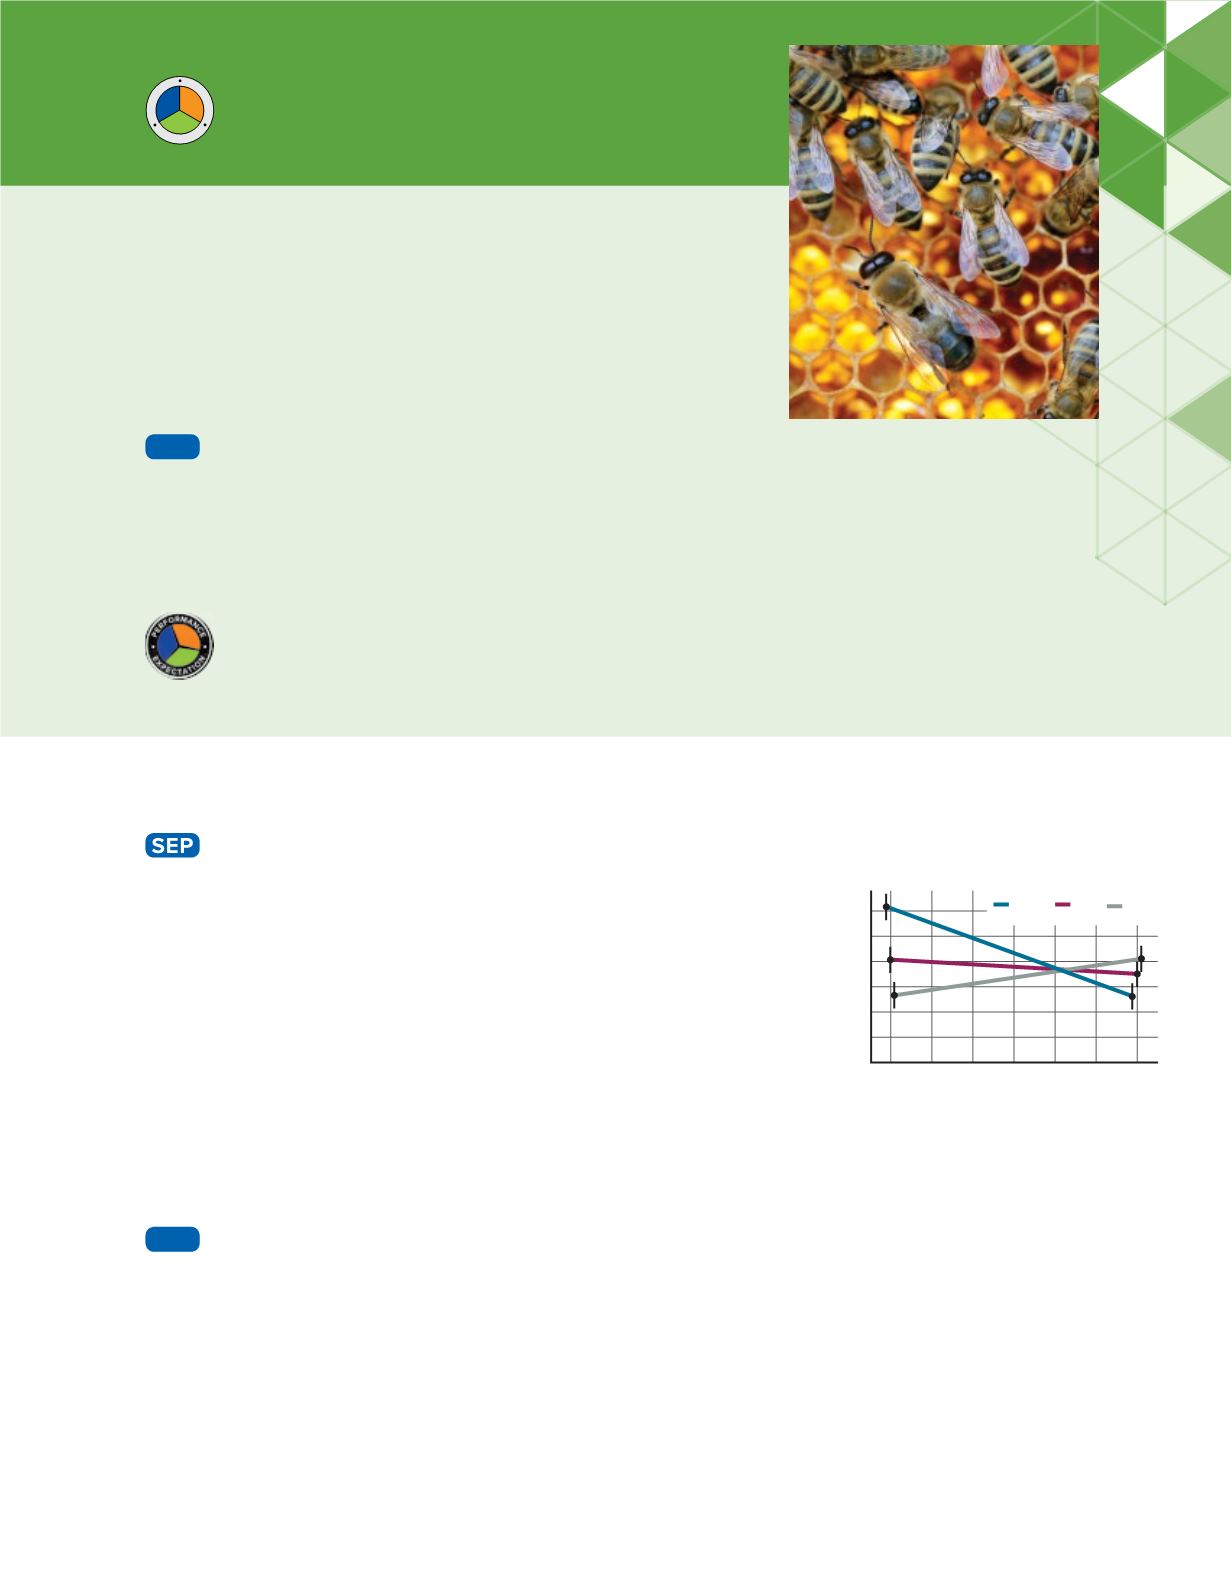
REVISIT THE PHENOMENON
Why are bee populations
declining?
CER
Claim, Evidence, Reasoning
Explain Your Reasoning
Revisit the claim you made when you encountered the
phenomenon. Summarize the evidence you gathered from your investigations and
research and finalize your Summary Table. Does your evidence support your claim? If not,
revise your claim. Explain why your evidence supports your claim.
STEM UNIT PROJECT
Now that you’ve completed the module, revisit your STEM unit project. You will
summarize your evidence and apply it to the project.
Module Wrap-Up
C
C
C
S
E
P
D
C
I
THREE-DIMENSIONAL THINKING
*Data obtained from: Gregory, R., et al. 2000.
Parasites take control.
Nature
406: 33–34.
GO FURTHER
Data Analysis Lab
Do parasites affect the size of a host population?
In 1994, the first signs of a serious eye disease caused by the
bacterium
Mycoplasma gallisepticum
were observed in house
finches that were eating in backyard bird feeders. Volunteers
collected data at the beginning of three different years on the
number of finches infected with the parasite and the total number
of finches present.
Data and Observations
The graph shows the abundance of
house finches in areas where the infection rate was at least 20
percent of the house finch population. It also shows the changes
in the population over the three years following the initial count.
CER
Analyze and Interpret Data
1.
Compare
the data from the three years.
2.
Claim, Evidence, Reasoning
Explain why the house finch
abundance stabilized in 1995 and 1996.
3.
Infer
whether the parasite is effective in limiting the size of
house finch populations. Explain.
Module 4 • Population Ecology
95