Access and Navigate Wonders/Maravillas Data Dashboard
Learn how teachers use the Wonders Data Dashboard to view reports, track progress, and analyze student literacy skills.
- Literacy
- SSO & Manual-Rostering
- Customer Support
- Direct Login & Auto-Rostering
- Maravillas 2020 & 2017
- Reports & Analytics
- Core
- Direct Login & Manual-Rostering
- Classroom Teacher
- Wonders Balanced Literacy 2016
- Wonders 2023 2020 2017
- SSO & Auto-Rostering
- PreK-12
- Elementary School
- Kindergarten
- 1st Grade
- 2nd Grade
- 3rd Grade
- 4th Grade
- 5th Grade
- 6th Grade
- Middle School


This article walks teachers through the Wonders/Maravillas Data Dashboard.
For a full page view of the demo, click here.
For a Spanish version of the demo, click here.
For a video walkthrough, click here.
Article Contents
Access Data Dashboard
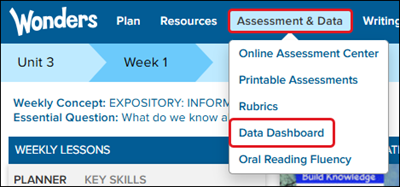
To access the Data Dashboard in Wonders, hover over Assessment & Data and select Data Dashboard from the menu.
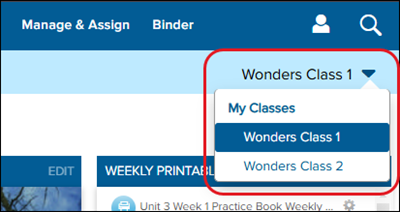
If you have more than one class associated to the program, select the class you want to view data for from the class drop-down.
Data Collection
The data that is collected for the reports from various resources. Each of these items is aligned to specific Wonders skills and ELA standards. Data is averaged to product student performance scores.
- Online Assessments
- Student Practice with Data Reporting Activities
- Observational Rubrics
Navigate the Data Dashboard
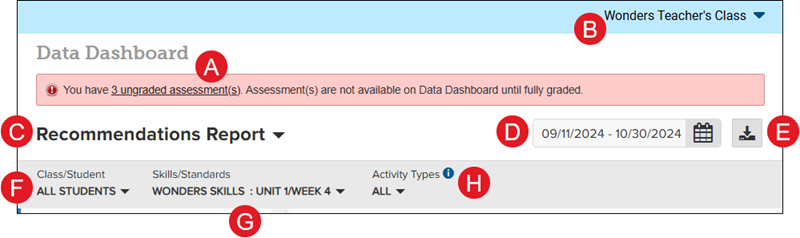
A. Ungraded Assessments — If there are any completed assessments that are in need of manual grading, you will have a message at the top of the Data Dashboard indicating this. Clicking on the ungraded assessment link will automatically navigate you to the Online Assessment Center page.
Note: Any assessments that need to be manually graded will need to be graded before they will show in the Data Dashboard.
B. Class Dropdown — If you have more than one class within your Wonders program, you can navigate between the class Data Dashboard views by selecting the class from the dropdown.
C. Report Options — Navigate between the Recommendations Report, Activity Report, Skills Report, Progress Report, and Grade Card Report.
D. Date Range — Click on the calendar icon to select a date range of data to view.
E. Export to PDF — Click the download button to export the current Data Dashboard view to PDF. This is only an option for the Recommendation Report and the Skills Report.
F. Class/Student — Select to view the data by class or for a specific student.
G. Skills/Standards — Select to view data by skills or standards.
H. Activity Types — Select to view All Activities, Assessments, Games, Rubric, and/or Practice data. More than one option can be selected at a time.
Report Types
To navigate to the different report options, click on the drop-down list in the upper-left corner of the Data Dashboard.
Recommendations Report
Helps measure students' mastery of skills and standards, access resources aligned to learning needs, and plan differentiated support.
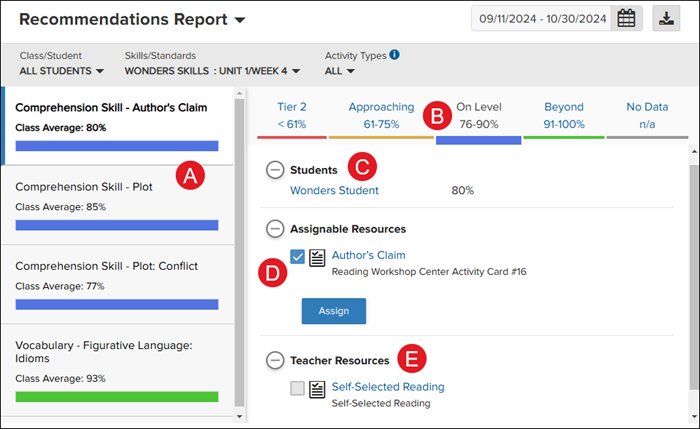
A. Report-Specific Information — Drill down the information further by selecting from the topics available. Each option will add/remove the resource options available under Students, Assignable Resources, and Teacher Resources. Each report will have its own list of topics available to select from.
B. Levels — Click on the different levels to view the list of students and resources for that level.
C. Students — Expand the section to view the list of students associated to the selected level.
D. Assignable Resources — Each level and report-specific information selection will have varying lists of resources that can be assigned to the students listed for the selected level. To assign the resource to the students, check the box next to the resource and click the Assign button.
E. Teacher Resources — Each level and report-specific information selection will have varying lists of resources for the teacher to use to assist the students listed for the selected level.
Activity Report
Provides detailed information about each activity that produces data, including online assessments, Student Practice with Data Reporting Activities, and rubrics.
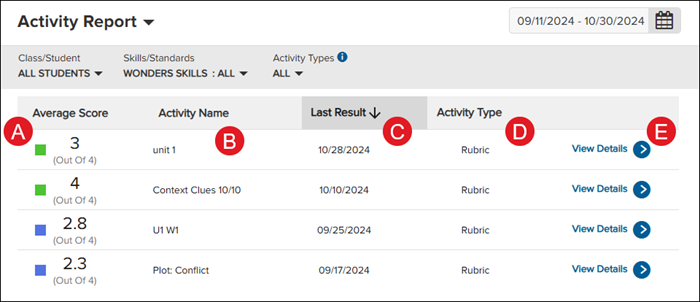
A. Average Score — The number of points each activity is worth and the average score of each activity.
B. Activity Name — The name of each assigned activity.
C. Last Result — The date in which the last student submitted the activity.
D. Activity Type — The type of activity that was assigned, including assessments, games, rubrics, and practice.
E. View Details — Click the View Details link to open the Activity Performance Details.
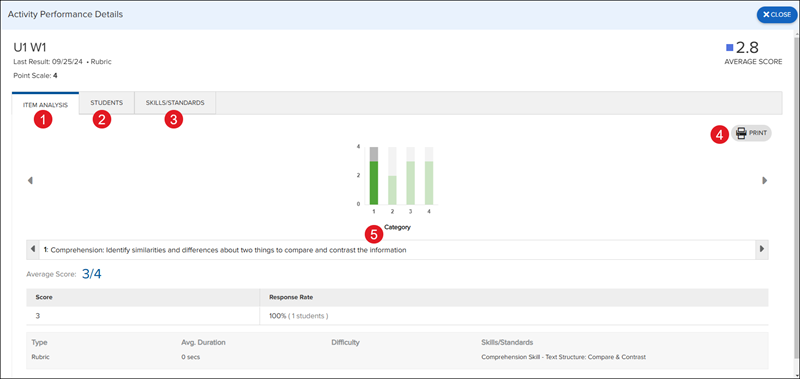
1. Item Analysis — View the different categories associated with the activity which include the activity type, the average duration of the activity, the difficulty level, and the associated skills and standards.
2. Students — View the list of students who completed the activity, their score for the activity, and the points they received for each question in the activity.
3. Skills/Standards — View the list of Skills/Standards associated with the activity.
4. Print — Click the print button to print/save the current view.
5. Category — Click on the different options in the bar graph to view the average score, response rate, activity type, the average duration of the activity, the difficulty level, and the associated skills and standards.
Skills Report
Provides information on the skills and standards assessed online and monitors class and student progress toward achieving learning goals.
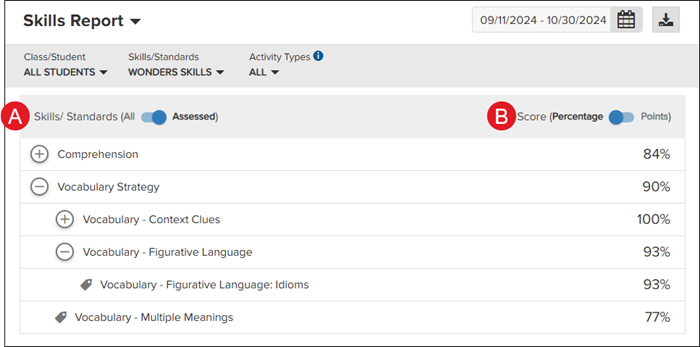
A. Skills/Standards — Toggle to view All skills/standards or only those that were Assessed. Click the + (plus) and/or - (minus) icons to expand and collapse the listed skills/standards.
B. Score — Toggle to view the Percentage or Points.
Progress Report
Charts overall student progress by tracking scores for each assessed skill and standard in graph form.
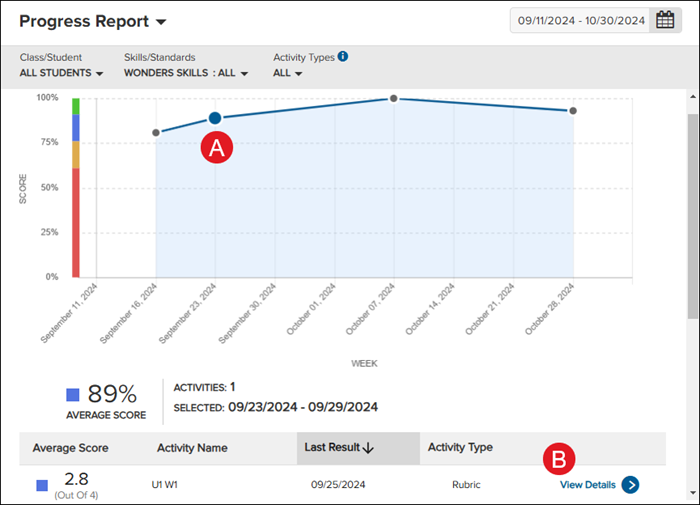
A. Score/Week — Click on a dot in the graph to view the activity details, including the average score, activity name, last result date, and the activity type.
B. View Details — Click the View Details link to open the Activity Performance Details.

1. Item Analysis — View the different categories associated with the activity which include the activity type, the average duration of the activity, the difficulty level, and the associated skills and standards.
2. Students — View the list of students who completed the activity, their score for the activity, and the points they received for each question in the activity.
3. Skills/Standards — View the list of Skills/Standards associated with the activity.
4. Print — Click the print button to print/save the current view.
5. Category — Click on the different options in the bar graph to view the average score, response rate, activity type, the average duration of the activity, the difficulty level, and the associated skills and standards.
Grade Card Report
Tracks student total scores for each grading period by listing each assessed skill and standard that makes up the grade, including highest and lowest performance.
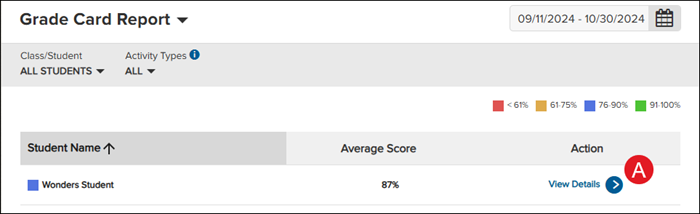
A. View Details — Click the View Details link to open the grade card report for the student that includes the aggregate score, recently completed activities, and the student's highest and lowest performance percentages.
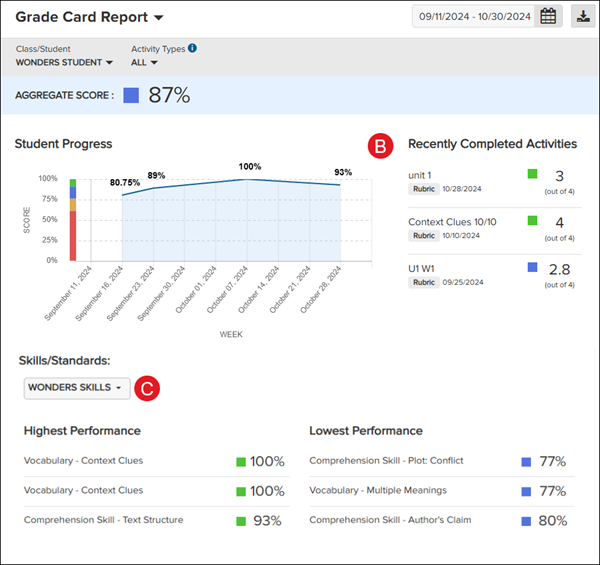
B. Recently Completed Activities — View the list of recent activities the selected student completed, including their score and the date they completed the activity.
C. Skills/Standards — Click the drop-down to toggle between viewing the skills or standards the student was assessed on.