MAP Growth RIT scores indicate what students know and what they are ready to learn. Based on the MAP Growth assessment, the Performance Report gathers NWEA information directly and indicates how your students are performing at the class and individual student levels.
Please note: This functionality is only available for districts that have completed the setup for NWEA MAP Growth™ integration. For more information on getting this completed for your district, reach out to your Organization or Curriculum Administrator.
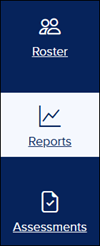
2. For Reveal Math and Reading Mastery Transformations users, click Reports on the navigation menu.
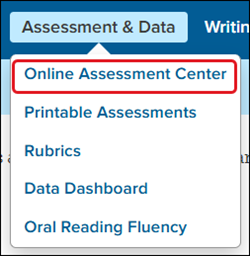
For Wonders and Maravillas users, hover over Assessment & Data and select Online Assessment Center from the menu.
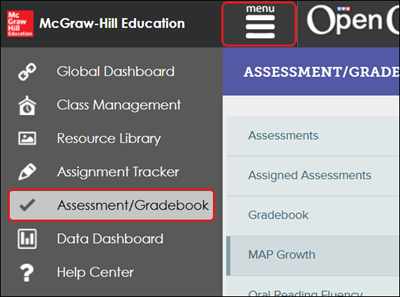
For Open Court Reading users, select Assessment/Gradebook from the menu.
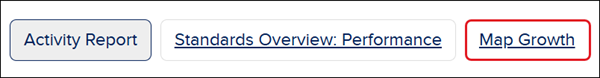
2. For Reveal Math and Reading Mastery Transformations, click the MAP Growth button at the top of the page.
For Wonders,Maravillas, and Open Court Reading, click the MAP Growth option from the Online Assessment Center tab.
3. Select the Assessment from the drop-down for the data you would like to view.
Class Performance
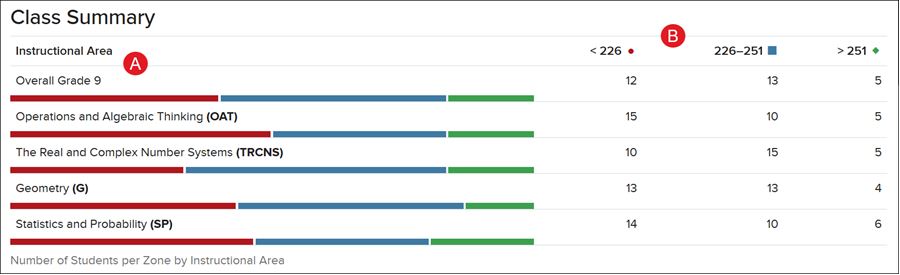
Class Summary
The Class Summary shows the overall performance of your class in the selected assessment, as well as the RIT scores for each instructional area. You can use this chart to understand which instructional areas are relative strengths and areas for improvement for your class.
A. The Instructional Area chart shows how the class performed for each instructional area.
B. Each row represents a distribution of achievement percentiles for an instructional area. These percentiles correspond to Approaching Level, At Level, and Beyond Level. Specific percentiles are determined by grade level.
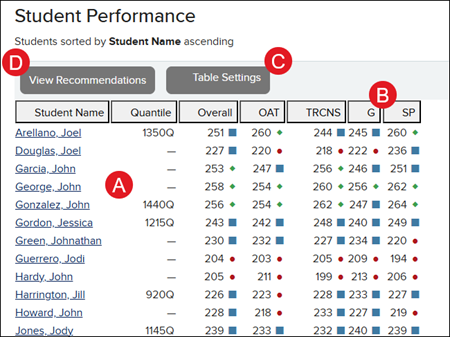
Student Performance
The Student Performance area organizes the individual RIT scores of each of your students for the selected assessment.
A. Each column indicates the student's percentile placement in their Overall score and in each Instructional Area.
OAT - Operations and Algebraic Thinking
TRCNS - The Real and Complex Number
G - Geometry
SP - Statistics and Probability
B. Click on a column header to sort the columns by that option.
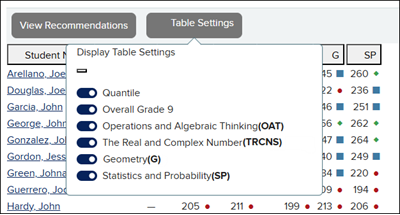
C. Click on Table Settings to add or remove column options.
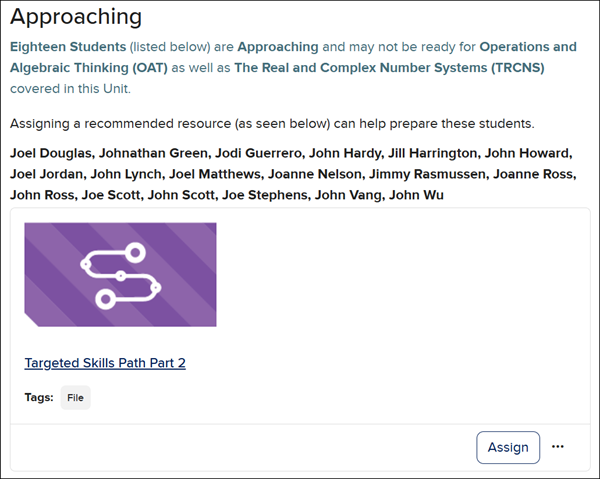
D. Click on View Recommendations to view the recommended assignments for the upcoming unit.
Note: This option is only available for Reveal Math and Reading Mastery Transformations.
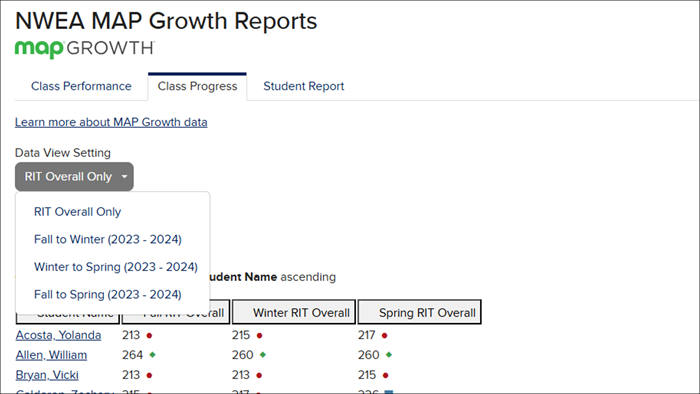
The Class Progress tab shows the individual student Overall RIT scores and the NWEA assessments for Fall, Winter, and Spring.
Click on the Data View Setting drop-down to navigate between the RIT Overall view and the comparison views for the different assessments completed.
Student Report
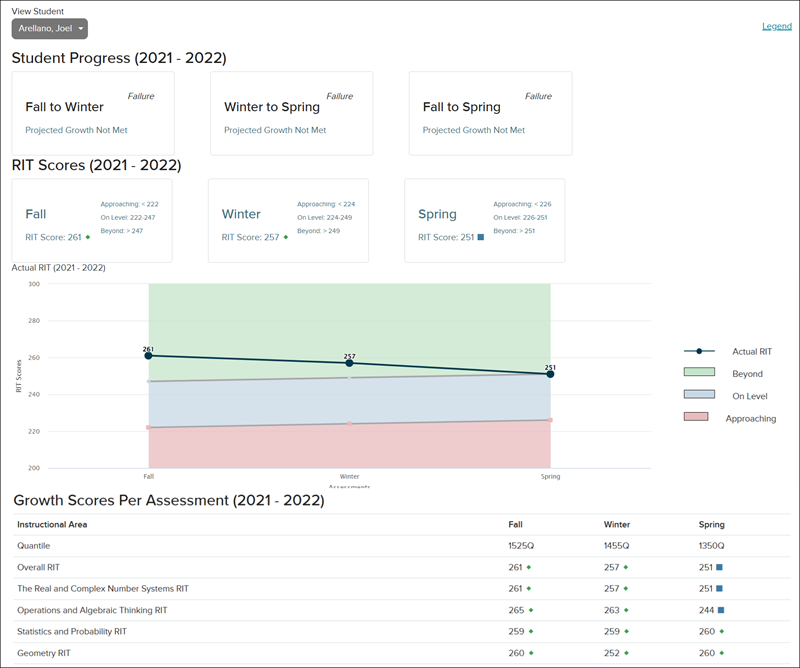
The Student Report page shows individual student growth scores and progress for each completed NWEA assessment. Click the View Student drop-down to navigate between student pages.
Math, Direct Instruction, Literacy, SSO & Manual-Rostering, Customer Support, Direct Login & Auto-Rostering, Reports & Analytics, Middle School, Core, Direct Login & Manual-Rostering, High School, CA Reveal Math (K-12), Open Court Reading, Classroom Teacher, Wonders 2023 2020 2017, SSO & Auto-Rostering, PreK-12, Preschool, Elementary School, Reading Mastery Transformations, Maravillas 2020 & 2017, Reveal Math (K-12)
dts
2026-03-24T18:42:37.017-03:00
For a full page view of the demo, click here. For a Spanish version of the demo, click here. Article Contents Access Performance Report View Performance Report Class Performance Class Summary Student Performance Class Progress Student Report MAP Growth RIT scores indicate what students know and what they are ready to learn. Based on the MAP Growth assessment, the Performance Report gathers NWEA information directly and indicates how your students are performing at the class and individual student levels. Please note: This functionality is only available for districts that have completed the setup for NWEA MAP Growth™ integration. For more information on getting this completed for your district, reach out to your Organization or Curriculum Administrator. Access Performance Report 1. SSO or log in at my.mheducation.com. 2. For Reveal Math and Reading Mastery Transformations users, click Reports on the navigation menu. For Wonders and Maravillas users, hover over Assessment & Data and select Online Assessment Center from the menu. For Open Court Reading users, select Assessment/Gradebook from the menu. 2. For Reveal Math and Reading Mastery Transformations, click the MAP Growth button at the top of the page. For Wonders, Maravillas, and Open Court Reading, click the MAP Growth option from the Online Assessment Center tab. 3. Select the Assessment from the drop-down for the data you would like to view. Class Performance Class Summary The Class Summary shows the overall performance of your class in the selected assessment, as well as the RIT scores for each instructional area. You can use this chart to understand which instructional areas are relative strengths and areas for improvement for your class. A. The Instructional Area chart shows how the class performed for each instructional area. B. Each row represents a distribution of achievement percentiles for an instructional area. These percentiles correspond to Approaching Level, At Level, and Beyond Level. Specific percentiles are determined by grade level. Student Performance The Student Performance area organizes the individual RIT scores of each of your students for the selected assessment. A. Each column indicates the student's percentile placement in their Overall score and in each Instructional Area. OAT - Operations and Algebraic Thinking TRCNS - The Real and Complex Number G - Geometry SP - Statistics and Probability B. Click on a column header to sort the columns by that option. C. Click on Table Settings to add or remove column options. D. Click on View Recommendations to view the recommended assignments for the upcoming unit. Note: This option is only available for Reveal Math and Reading Mastery Transformations. For more on NWEA MAP Growth Recommendations, see this article: NWEA MAP Growth™ for Teachers Recommendations. Class Progress The Class Progress tab shows the individual student Overall RIT scores and the NWEA assessments for Fall, Winter, and Spring. Click on the Data View Setting drop-down to navigate between the RIT Overall view and the comparison views for the different assessments completed. Student Report The Student Report page shows individual student growth scores and progress for each completed NWEA assessment. Click the View Student drop-down to navigate between student pages. Related Articles NWEA® MAP® Growth™ for Teachers Recommendations
Top
Regional Page Available
It looks like you're outside the United States. Do you want to see your regional version of this page?