Classic ALEKS QuickTables View Reports
Review QuickTables reports in classic ALEKS view to monitor fluency progress.
- Supplemental
- SSO & Manual-Rostering
- Customer Support
- Direct Login & Auto-Rostering
- Reports & Analytics
- Middle School
- ALEKS
- Direct Login & Manual-Rostering
- High School
- Classroom Teacher
- SSO & Auto-Rostering
- PreK-12


This article walks teachers through viewing the QuickTables reports for students.
For a full page view of the demo, click here.
For a Spanish version of the demo, click here.
Article Contents
QuickTables Progress Report
1. SSO or log in at my.mheducation.com.
2. Launch ALEKS.
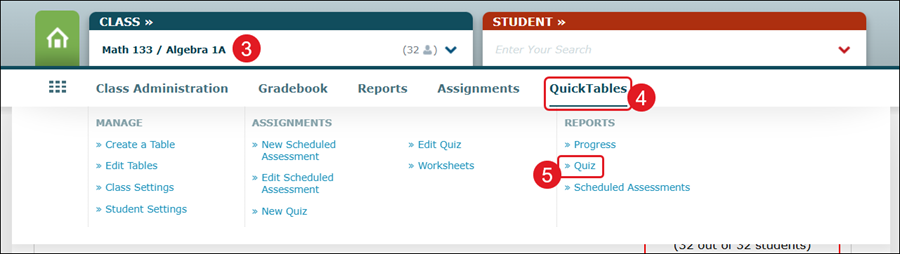
3. Select the Class from the drop menu.
4. Hover over Reports.
5. Click on QuickTables from the menu.
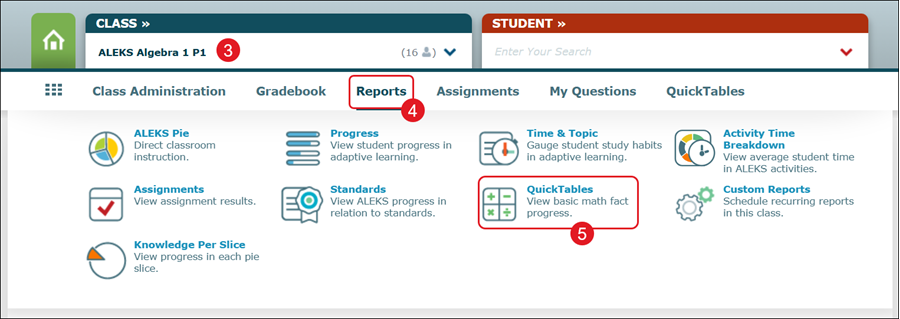
You can also hover over QuickTables and click Progress from the Reports section of the menu.
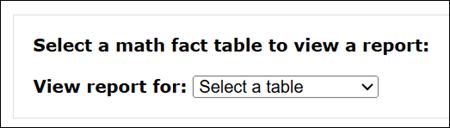
6. Select a table from the View report for drop-down.
Note: You will only see options for QuickTables you've created.
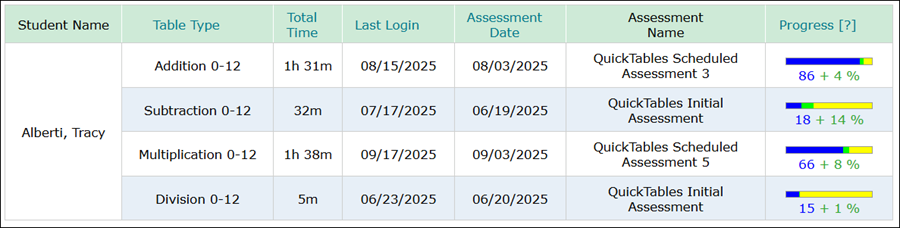
The report provides information on each student assigned to the select table.
7. Select the table you want to view the report for.
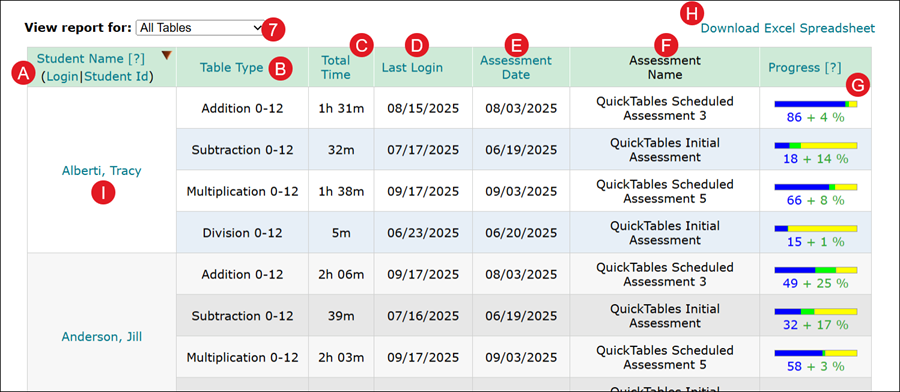
A. Click on a header name to sort by that column.
B. The Table Type shows the type of table assigned to the students.
C. The Total Time shows the hours and minutes it took for the student to complete the assigned QuickTables assessment.
D. The Last Login shows the last time they launched into the QuickTables.
E. The Assessment Date shows the date they completed the assigned QuickTables assessment.
F. The Assessment Name provides the name of the completed QuickTables assessment.
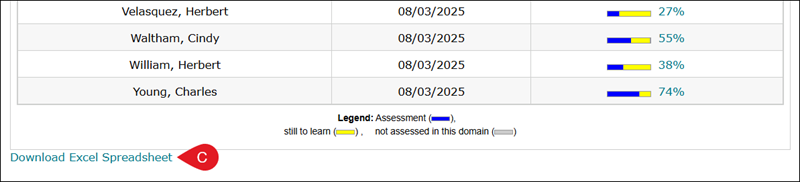
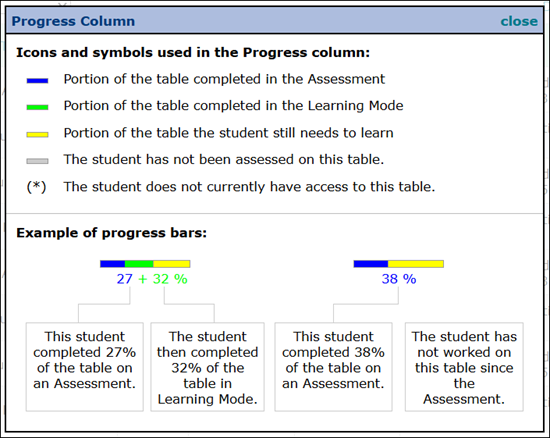
G. The Progress column provides details of their completion for the QuickTables assessment.
Blue indicates the portion of the table completed in the Assessment.
Green indicates the portion of the table completed in the Learning Mode.
Yellow indicates the portion of the table the student still needs to learn.
Gray indicates that the student has not yet been assessed on the table.
An asterisk indicates the student does not currently have access to the table.
H. Click the Download Excel Spreadsheet link to download the report.
I. Click a Student Name to view the individual student QuickTables report.
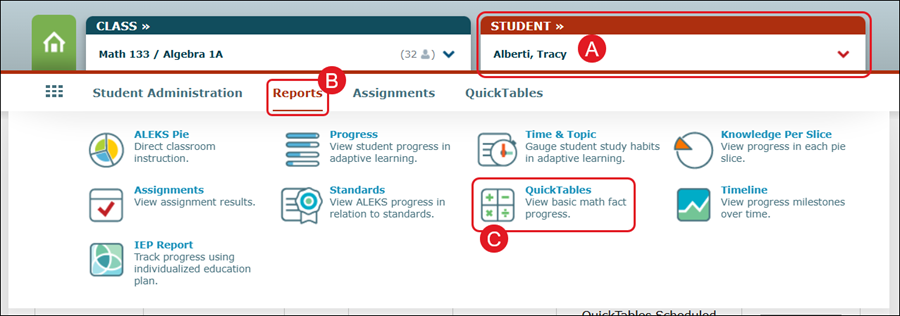
You can also view the individual student report by selecting the Student (A) from the drop-down, hovering over Reports (B), and clicking on QuickTables (C) from the menu.
QuickTables Quiz Report
1. SSO or log in at my.mheducation.com.
2. Launch ALEKS.
3. Select the Class from the drop menu.
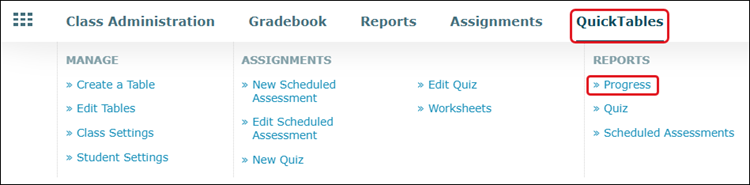
4. Hover over QuickTables.
5. Click Quiz from the Reports section of the menu.
6. Select the QuickTables option you want to View results for from the drop-down.
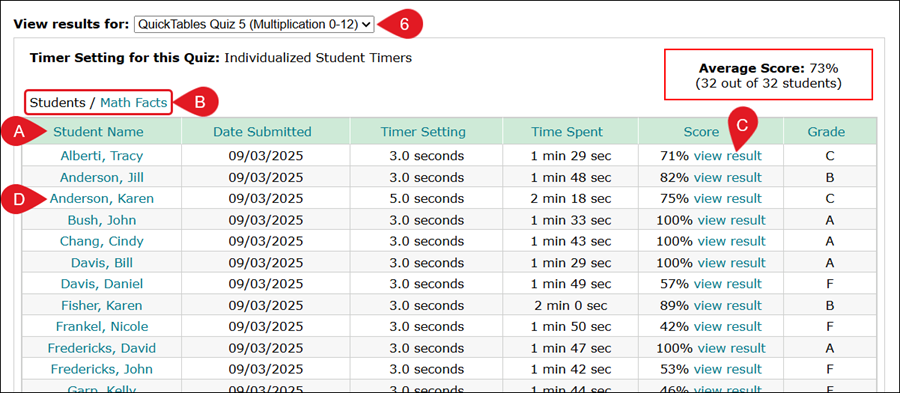
A. Click on a header to organize the data by that column.
B. Click Students or Math Facts to toggle between the two report views.
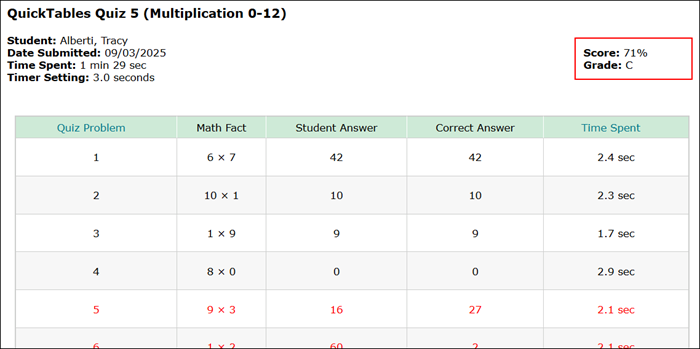
C. Click the View Result link in the Score column to view a breakdown of each quiz problem with the student answer, correct answer, and time spent.
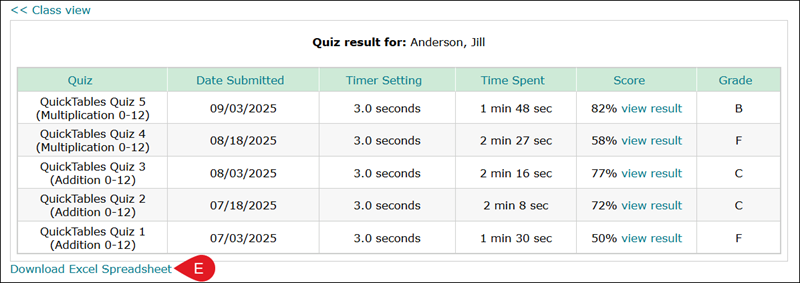
D. Click the Student Name to view the student results for each quiz.
The table includes the Quiz name, Date Submitted, Timer Setting, Time Spent, Score, and Grade.
E. Click the Download Excel Spreadsheet link at the bottom of the page to print/save the report data.
Scheduled Assessments
1. SSO or log in at my.mheducation.com.
2. Launch ALEKS.
3. Select the Class from the drop menu.
4. Hover over QuickTables.
5. Click Scheduled Assessments from the Reports section of the menu.
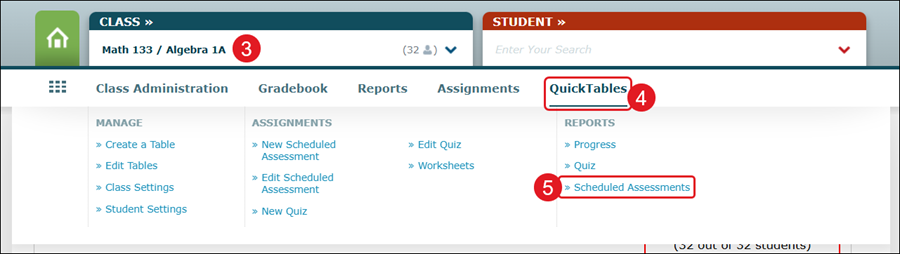
6. Select the QuickTables option you want to View results for from the drop-down.
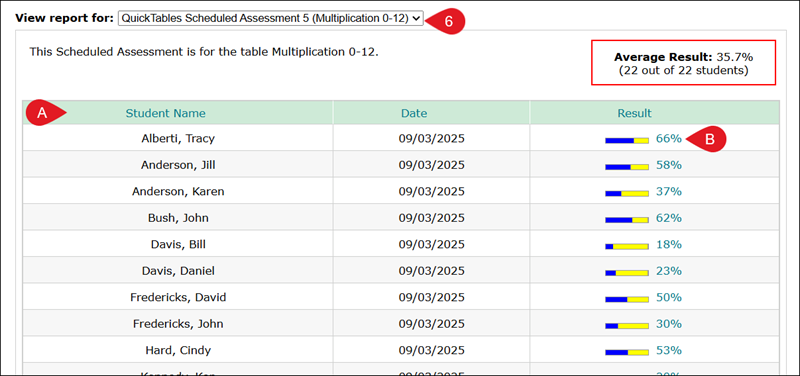
A. Click on a header to organize the data by that column.
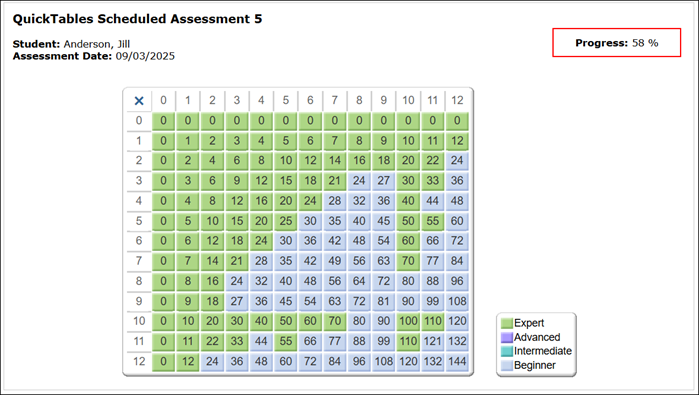
B. Click the score percentage in the Result column to view a table breakdown of the assessment.
Blue shows the percentage of the completed assessment.
Yellow shows the percentage still to learn.
Gray shows the percentage not assessed in that domain.
The table will show where the student is an Expert, Advanced, Intermediate, or Beginner.
C. Click the Download Excel Spreadsheet at the bottom of the page to print the report data.