Review and Export eAssessment Teacher Reports
Learn how to generate and navigate through eAssessment teacher reports.
Tags
- Customer Support
- PreK-12
- Classroom Teacher
- Preschool
- Elementary School
- Middle School
- High School
- Direct Login & Auto-Rostering
- Direct Login & Manual-Rostering
- SSO & Auto-Rostering
- SSO & Manual-Rostering
- Core
- Intervention
- Supplemental
- AP, Honors & Electives
- Literacy
- Math
- Science
- Social Studies
- Health
- Visual & Performing Arts
- World Languages
- Asi se Dice 2016
- Building Blocks 2015
- Core Plus Math 2015
- Glencoe Health 2014
- Glencoe Algebra 1 2014
- Glencoe Algebra 1 2018
- Glencoe Algebra 2 2014
- Glenoce Algebra 2 2018
- Glencoe Geometry 2014
- Glencoe Geometry 2018
- Glencoe Math Accelerated
- Glencoe Math
- Glencoe Math Course 1
- Glencoe Math Course 2
- Glencoe Math Course 3
- Glencoe Science
- Glencoe Science 2017
- Inspire Science 2017
- iScience 2017
- McGraw Hill My Math 2013 & 2016
- Networks 2014 & 2016
- Networks 2014 (K-5)
- Pre-Algebra 2012
- Wonders 2014
- Online Assessments
- Reports & Analytics
- Grades & Assignments


Article Contents
Access Reports
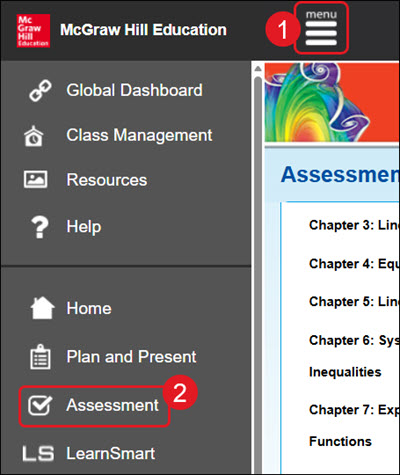
- Click Menu at the top left.
- Click Assessment from the menu.
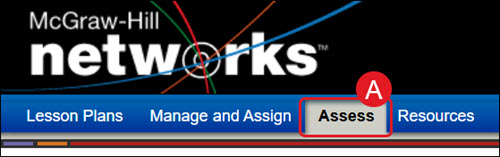
A. For some programs, such as Networks, you will need to click on Assess in the navigation bar.
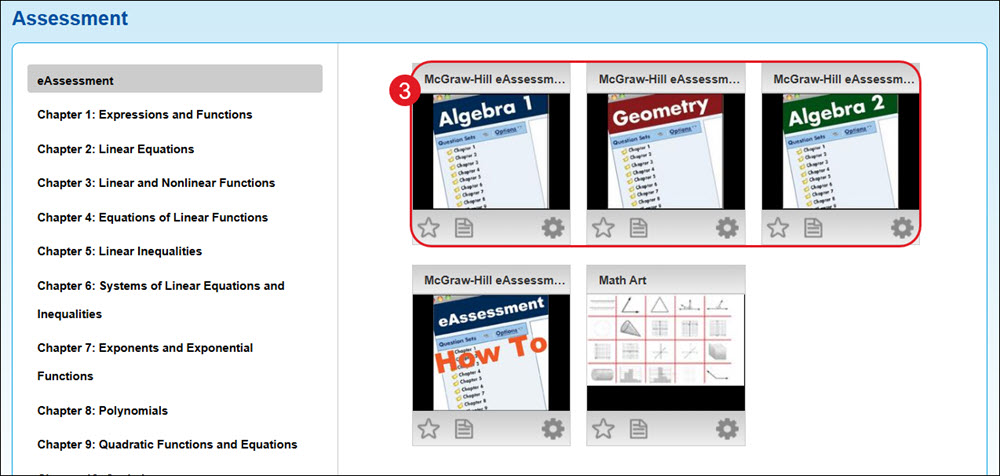
- Click on the eAssessment tile.
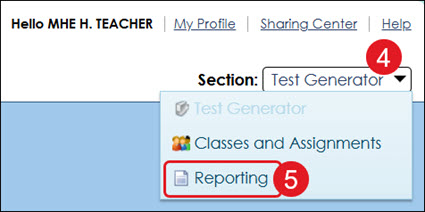
- Click on the Section drop-down.
- Click Reporting from the menu.
Class Reports
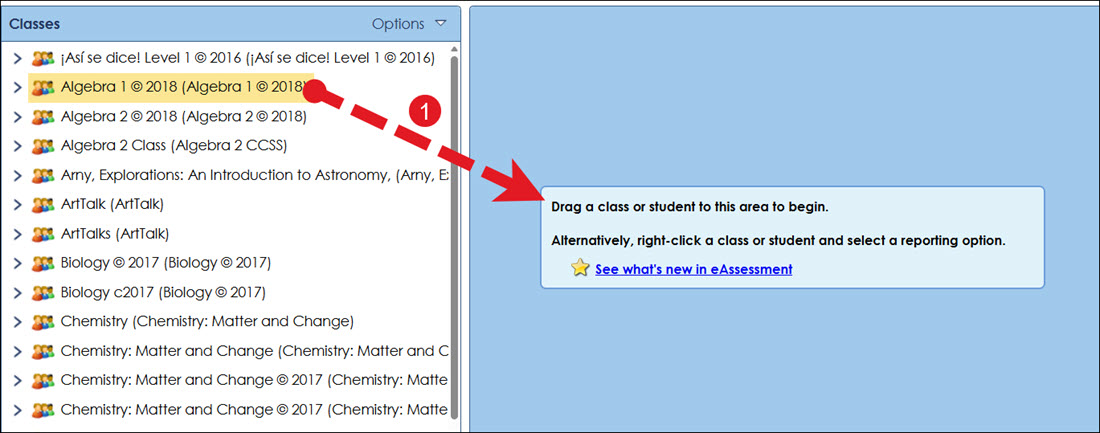
- Click and drag the Class into the middle of the screen (blue area).
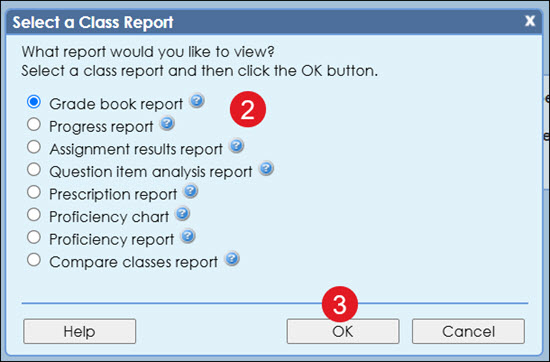
- Select the radio button for the Class Report you want to view.
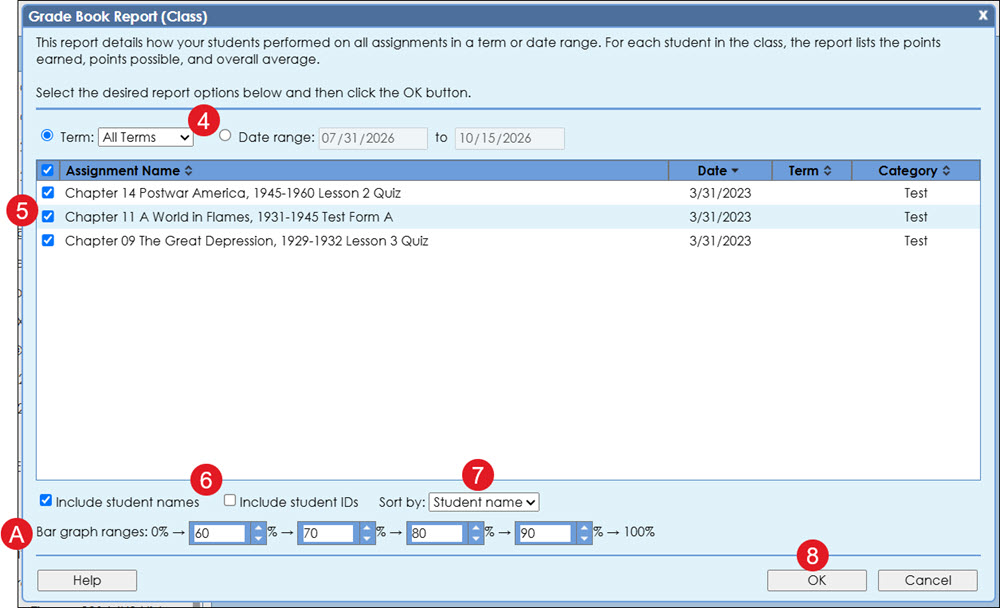
- Grade book report - This report details how your students performed on all assignments in a term or date range. For each student in the class, the report lists the points earned, points possible, and overall average.
- Progress report - This report details class performance on all assignments in a term or date range. For each assignment, the report lists the assignment name, category, the number of students who took the assignment, the date, the points possible, and the average score.
- Assignment results report - This report details how your students performed on a selected assignment. For each student in the class, the report lists the assignment score, the number of attempts, the start time, and the assignment duration. The report also provides a detailed statistical analysis and bar graph of the assignment results.
- Question item analysis report - This report details class performance on each question of an assignment. This will assist you in identifying invalid questions and areas that may need additional instruction.
- Prescription report - This report details class performance on a selected assignment. Based upon each student's proficiency, students may receive a prescription for the assignment.
- Proficiency chart - This report provides an easy-to-use visual representation of student proficiency levels. For each standard, the report displays the number of question items and a visual representation of each student's proficiency level.
- Proficiency report - This report details class proficiency on all standards during a specific term or date range. For each standard covered, the report displays the number of question items, a graph that shows the class average and range of scores, and the number of proficient students.
- Compare classes report - This report will compare the standards covered by two classes. For each standard, the report displays the number of question items, the average score, and the percentage of students who are proficient for each class.
- Click the OK button.
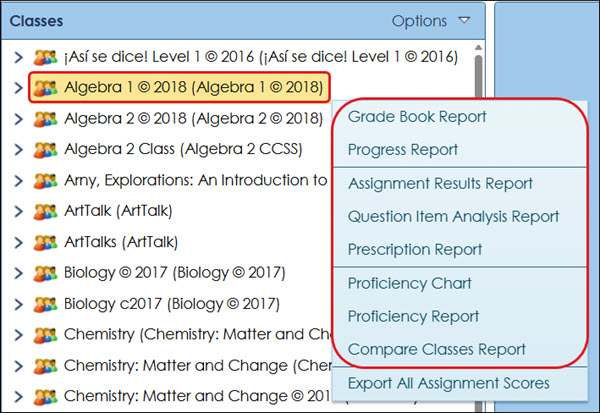
You also have the option to right-click on the class name and select the report type from the menu.
- Select the radio button to view by a specific Term or a Date range.
- Depending on the report type selected, select one or more Assignments from the list.
- Check/uncheck to Include student names and/or Include student IDs.
- Select the preferred Sort by option from the drop-down.
A. Make any necessary changes to the Bar graph ranges.
- Click the OK button.
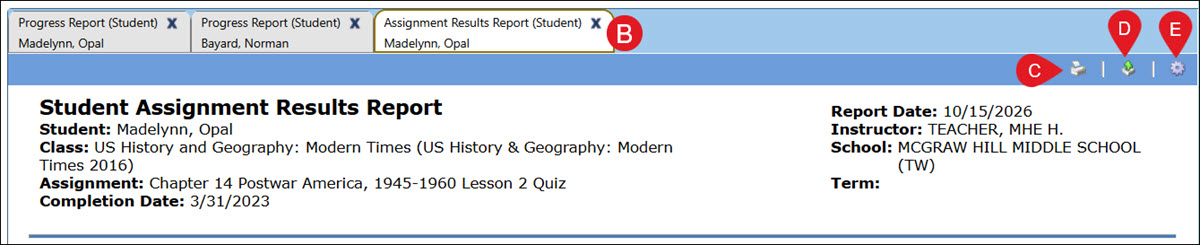
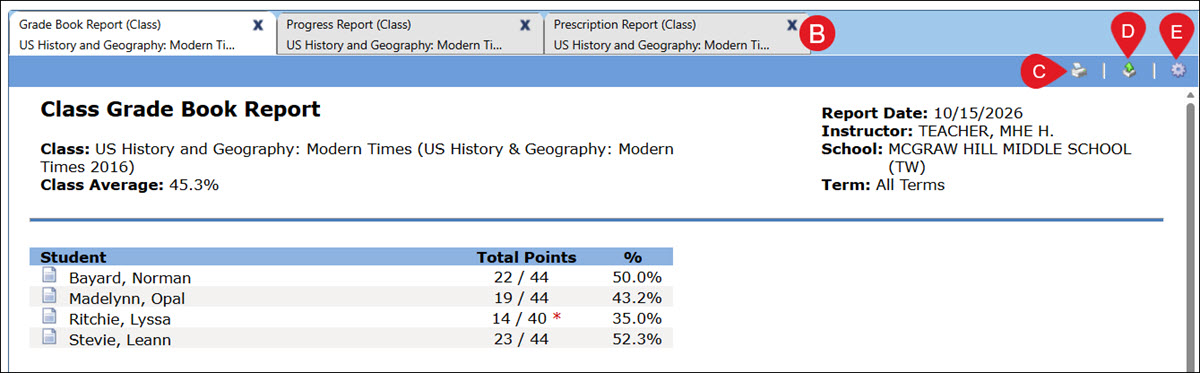
B. You can have multiple report types open at one time and easily navigate between them by clicking on the report tab.
C. Click the Print button to save/print the selected report. This will open in a new window.
D. Click the Export to CSV button to export the report data.
E. Click the Settings button to make adjustments to the report selections.
Student Reports
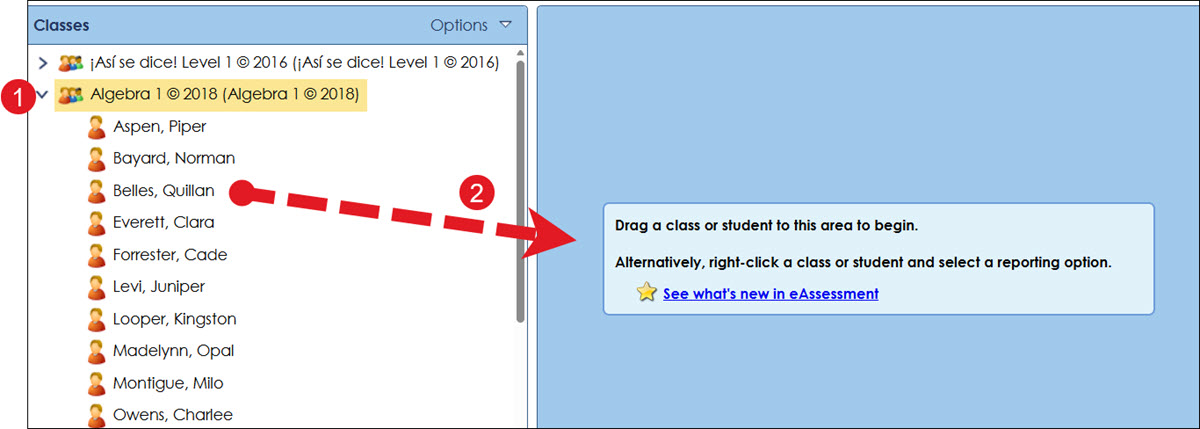
- Click on a Class to expand the student list.
- Click on a student name and drag it into the middle of the screen (blue area).
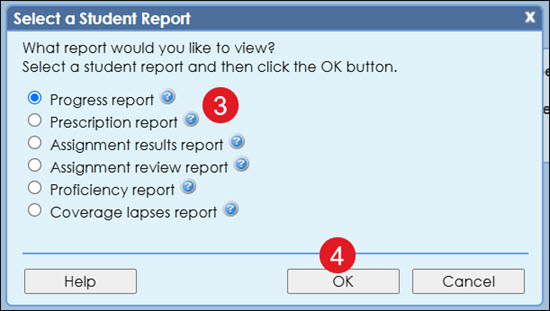
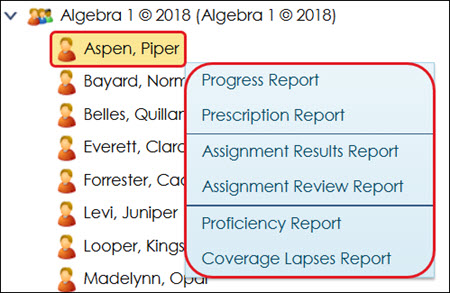
- Select the radio button for the Student Report you want to view.
- Progress report - This report details class performance on all assignments in a term or date range. For each assignment, the report lists the assignment name, category, the number of students who took the assignment, the date, the points possible, and the average score.
- Prescription report - This report details class performance on a selected assignment. Based upon each student's proficiency, students may receive a prescription for the assignment.
- Assignment results report - This report details how your students performed on a selected assignment. For each student in the class, the report lists the assignment score, the number of attempts, the start time, and the assignment duration. The report also provides a detailed statistical analysis and bar graph of the assignment results.
- Assignment review report - This report enables a student to review their mistakes on a selected assignment. For each question answered incorrectly, the report displays the question, the student's response, the correct answer, the rationale, the reference, the selected focus area, and remediation information.
- Proficiency report - This report details class proficiency on all standards during a specific term or date range. For each standard covered, the report displays the number of question items, a graph that shows the class average and range of scores, and the number of proficient students.
- Coverage lapses report - This report identifies any standards that were missed by a specific student even though the standards were covered by his/her class. This will assist you in recognizing lapses in coverage for reasons such as absenteeism.
- Click the OK button.
You also have the option to right-click on the student's name and select the report type from the menu.
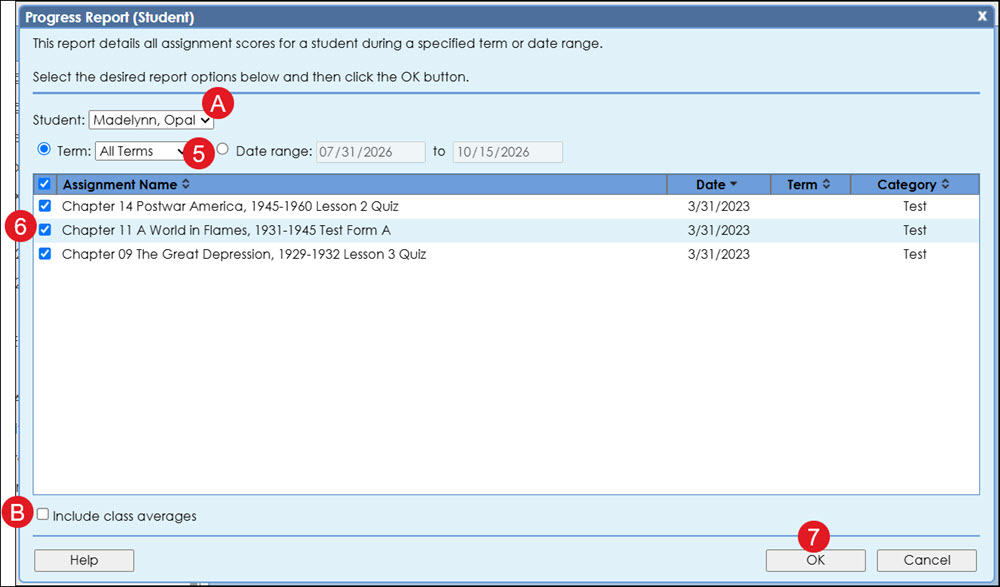
- Select to view the report by a specific Term or Date range.
A. Select a Student from the drop-down to view a report for a different student.
- Depending on the report type selected, select one or more assignments.
B. Check the box if you want to Include class averages in the report.
- Click the OK button.
B. You can have multiple report types and/or student reports open at one time and easily navigate between them by clicking on the report tab.
C. Click the Print button to save/print the selected report. This will open in a new window.
D. Click the Export to CSV button to export the report data.
E. Click the Settings button to make adjustments to the report selections.