PRoPL Reporting
Learn how to access and navigate reports for PRoPL.
- Customer Support
- PreK-12
- Classroom Teacher
- Elementary School
- Middle School
- High School
- Direct Login & Auto-Rostering
- Direct Login & Manual-Rostering
- SSO & Auto-Rostering
- SSO & Manual-Rostering
- Core
- Supplemental
- Literacy
- Math
- CA Reveal Math (K-12)
- Reveal Math (K-12)
- McGraw Hill Literacy Emerge!
- McGraw Hill Literacy Summit!
- McGraw Hill Literacy Soar!
- ALEKS
- Reports & Analytics


View the demo in a separate tab.
View the Spanish version of the demo.
The Pearson Review of Progress & Learning (PRoPL) is a computer-based interim assessment intended to be administered three times throughout the school year to measure student growth. PRoPL covers a broad set of academic standards to provide information about what students know and can do.
PRoPL is designed to provide scores and performance levels for a specific content area (i.e., math or reading). In addition, PRoPL provides information by reporting category, (e.g., Reading for Information or Numbers and Operations in Math), and Lexile (reading) scores. Growth in student performance from one assessment to the next within a given instructional year is shown in PRoPL reports.
Article Contents
Access PRoPL Reports
1. SSO or sign in at my.mheducation.com.
2. Launch the course.
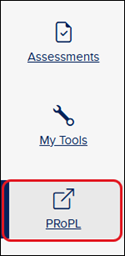
3. Click on PRoPL from the navigation menu.
The program will launch in a second browser tab.
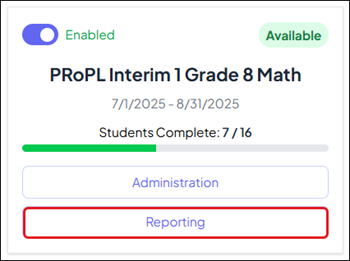
4. Click the Reporting button on the session you want to view reports for.
Class Reports
After students complete testing their performance and results will immediately populate teacher reports.
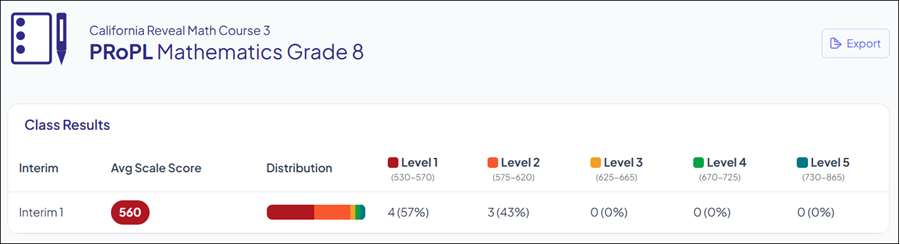
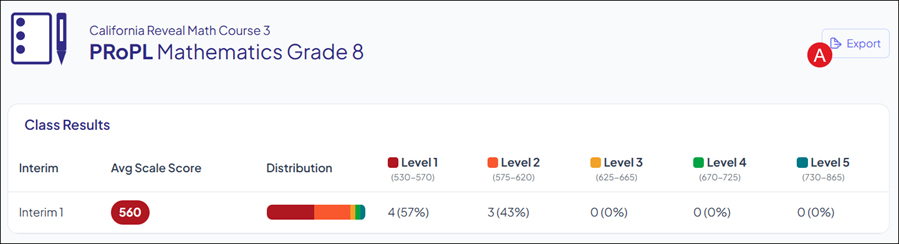
The top section of the Reporting dashboard shows the Class Results with the Average Scale Score and Distributions across the Performance Levels.
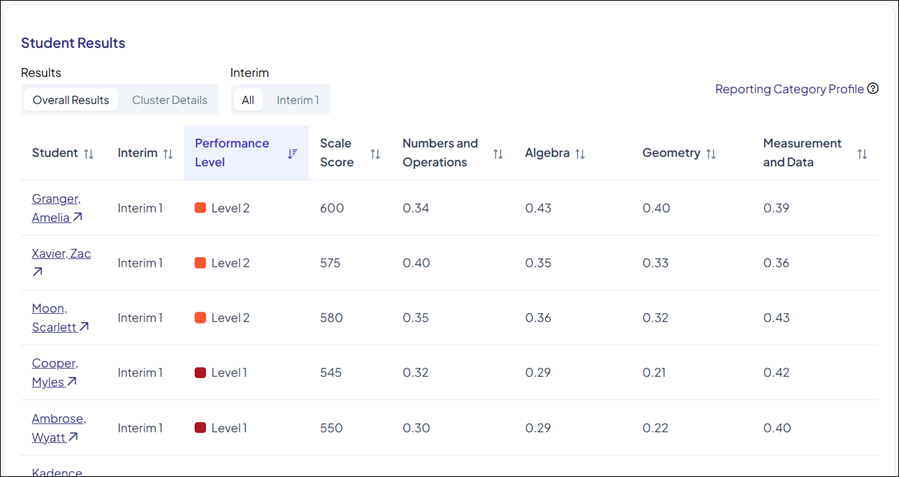
The lower section of the dashboard shows individual Student Results, including Reporting Category Profile performance, Performance Level, Scale Score, and Standard Cluster Details.
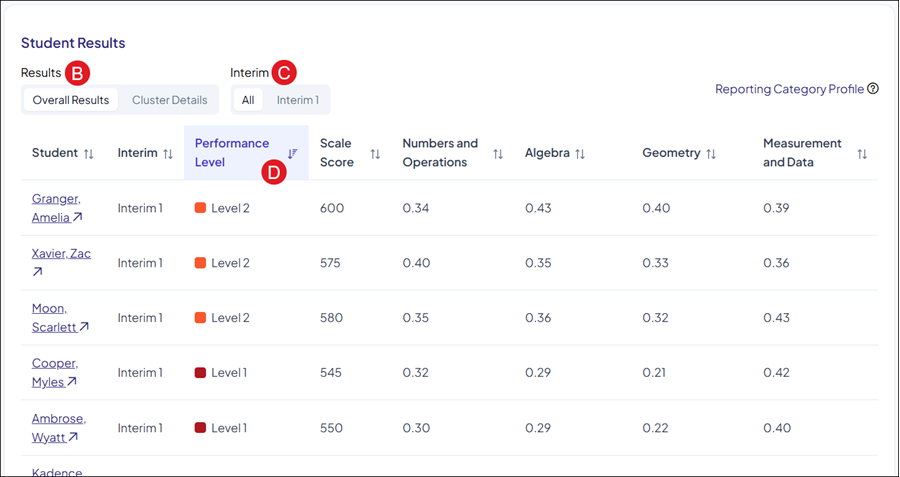
A. Export button - Teachers can export the data to a CSV file using the Export button in the upper right.
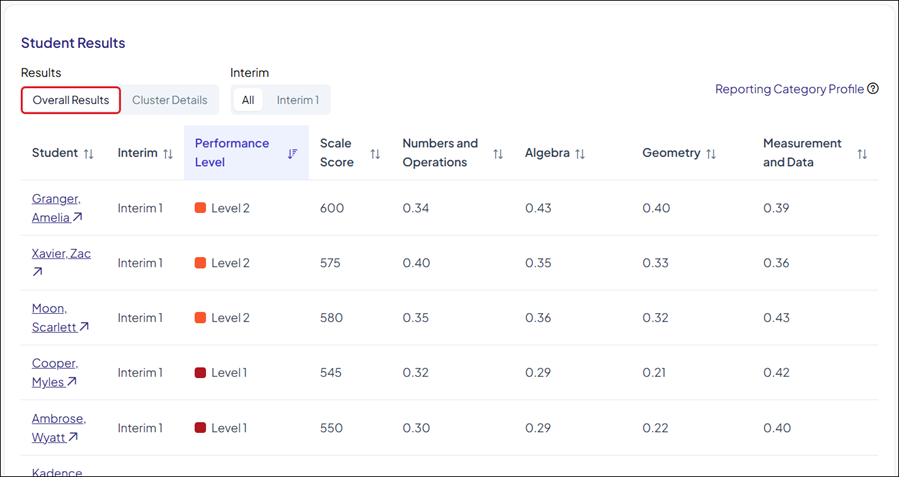
B. Results toggle - Teachers can toggle between viewing the Overall Results and Cluster Details by clicking on the preferred option under Results.
C. Interim toggle - Teachers can toggle between viewing All interim sessions or Interim 1, Interim 2, and Interim 3 separately by clicking on the preferred option under Interim.
D. Sorting data - Teachers can sort the data columns by clicking on the column they would prefer to view the data by.
On the Overall Results view, the Reporting Category Profile (RCP) details are available.
The RCP is a probability that indicates the proportion of items out of 100 a student would likely answer correctly, based on the correct responses at the reporting category level conditioned by the total test score. These probability values are shown between 0 and 1.
An RCP value in a category of 0.78 indicates the student would likely answer 78 out of 100 items similar to those on this test correctly.
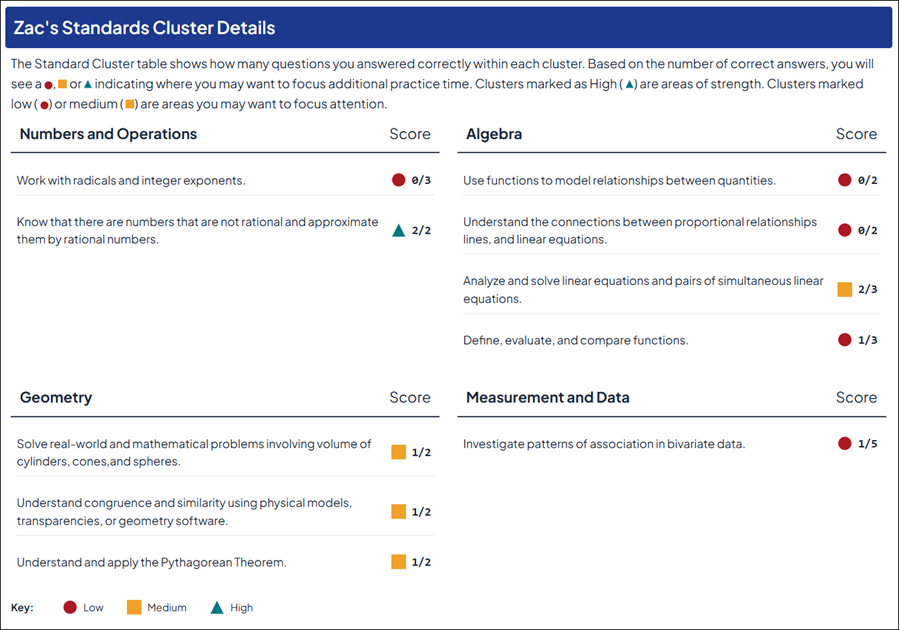
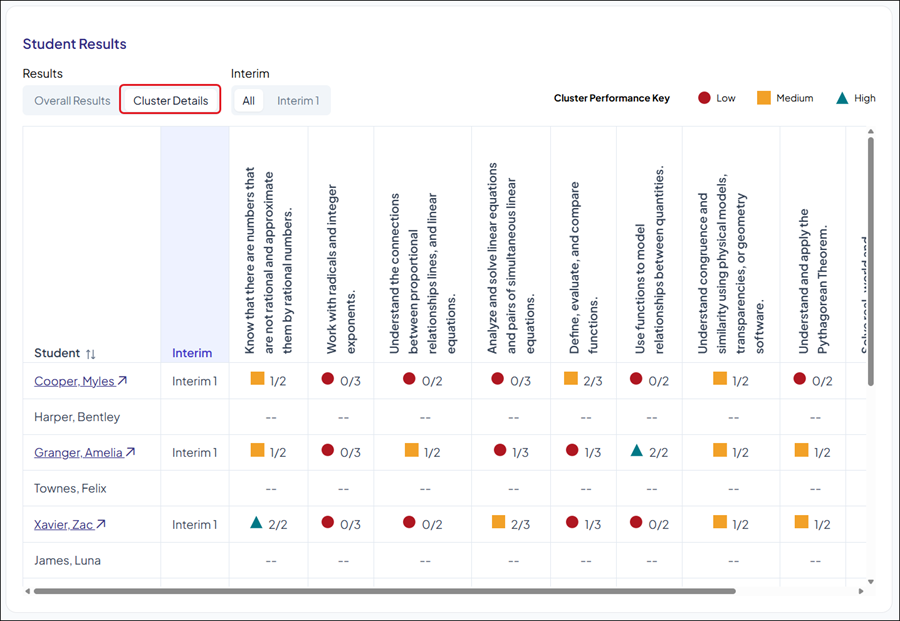
If you switch to the Cluster Details view, you will see how many questions the student answered correctly within each cluster.
Based on the number of correct answers, you will see a red circle, a yellow square, or a green triangle; this indicates where the student may want to focus additional practice time.
Clusters marked as High (green triangle) are areas of strength. Clusters marked Low (red circle) or Medium (yellow square) are areas they may want to focus attention.
Levels and Scales
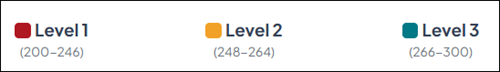
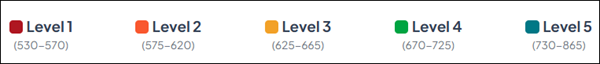
For grades K-2 there are three Performance Levels, and for grades 3-8 there are five.
Scales scores are used to report test scores and aid in score interpretation. Standardized scale scores allow for the comparison of a given score with scores of other students taking the test within the same grade and subject.
PRoPL results provide visualizations indicating where average scores or a student’s score falls within the scale score range.
The scale score range for PRoPL kindergarten is 100-190, and grade 1-2 is 200-300.
Grade 1-2 Scale:
The scale score range for PRoPL grades 3-8 is on a vertical scale from 435-865. Grade level ranges are defined within each grade and intervals within that range.
Individual Student Reports
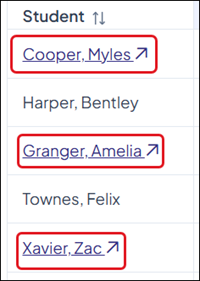
Teachers can view Individual Student Reports (ISR) by clicking on an individual student’s name (clickable student names will show with an arrow icon).
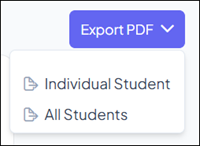
Clicking the Export PDF button at the top-right of the page allows to print by Individual Student or All Students.
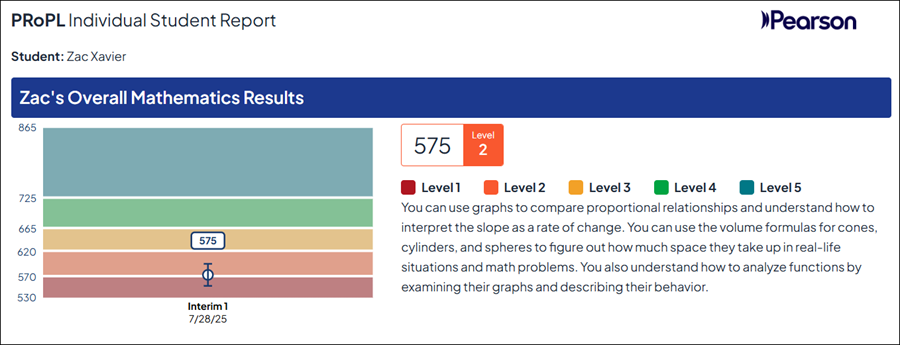
The PRoPL Individual Student Report (ISR) is divided into three sections work together to paint a picture of student growth and performance over time:
Section 1 - provides overall score information including Scale Scores and Performance Levels.
Teachers and students can use graphs to compare proportional relationships and understand how to interpret the slope as a rate of change. They can also use the volume formulas for cones, cylinders, and spheres to figure out how much space they take up in real-life situations and math problems.
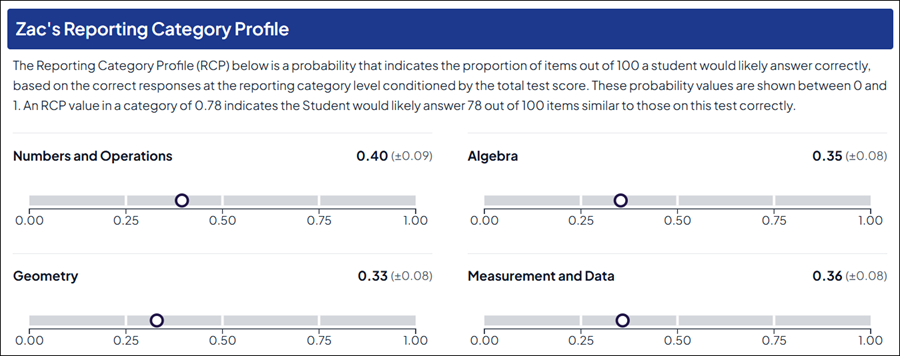
Section 2 - provides information on student performance at the Reporting Category level.
The Reporting Category section is a probability that indicates the proportion of items out of 100 a student would likely answer correctly, based on the correct responses at the reporting category level conditioned by the total test score. These probability values are shown between 0 and 1. An RCP value in a category of 0.78 indicates the Student would likely answer 78 out of 100 items similar to those on this test correctly.
Section 3 - provides students with a breakdown of their performance by Standard Cluster.
The Standard Cluster table shows how many questions the student answered correctly within each cluster.