K-12 Connect® Teacher Item Analysis Report
Discover how to analyze question‑level results using the Connect® Item Analysis Report.
- AP Connect
- SSO & Manual-Rostering
- Customer Support
- Direct Login & Auto-Rostering
- Reports & Analytics
- Middle School
- Direct Login & Manual-Rostering
- High School
- AP, Honors & Electives
- Classroom Teacher
- SSO & Auto-Rostering
- PreK-12


For a full page view of the demo, click here.
For a Spanish version of the demo, click here.
The item analysis report provides statistics on each question within a single assignment. Teachers will be able to view the section average score on each question within a single question bank assignment or compare multiple sections’ scores.
The item analysis report is the best way to get a bird’s eye view of a single assignment. When you want to see what your class is struggling with on a particular assignment or quiz, this report will help by providing you with the average score for each individual question across all students’ attempts, the average of best scores, and the average of the most recent attempts on the question. Teachers will be able to tell if students are improving on the activity and concepts, if the concepts are something teachers want to spend additional time on in class, or address in a future assignment.
Article Contents
Access the Item Analysis Report
Access the Item Analysis Report
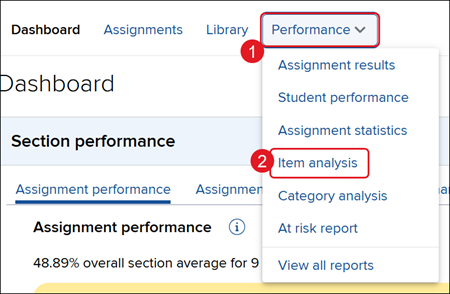
1. Click on the Performance menu.
2. Click on Item analysis from the menu.
Select Report Filters
There are a variety of options from which you can choose to customize the report to best fit your needs.
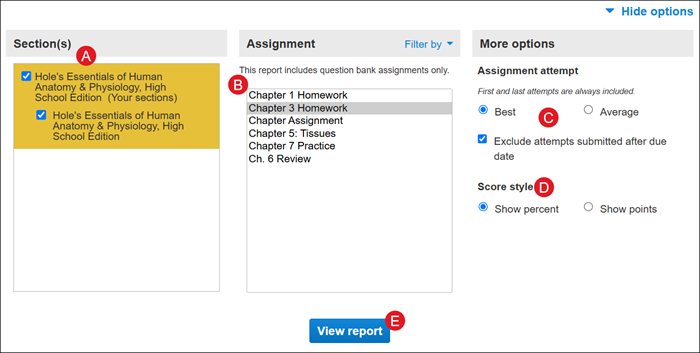
A. Section(s) – Select which sections of your course will be on the report. Choose from the current section, sections within the same course, and secondary instructor’s shared sections (if applicable).
B. Assignment(s) – Select one assignment to be displayed in the report. Your choice of sections determines the assignments listed here. Note that only question bank assignments can be used for this report.
C. Assignment attempt - Select the radio button to view the Best or Average score for the selected assignment.
Uncheck the box next to Exclude attempts submitted after due date if you want to see submitted student scores after the assignment due date had passed.
D. Score style - Select the radio button to view the scores as a percentage or points.
E. Click the View report button.
View Report
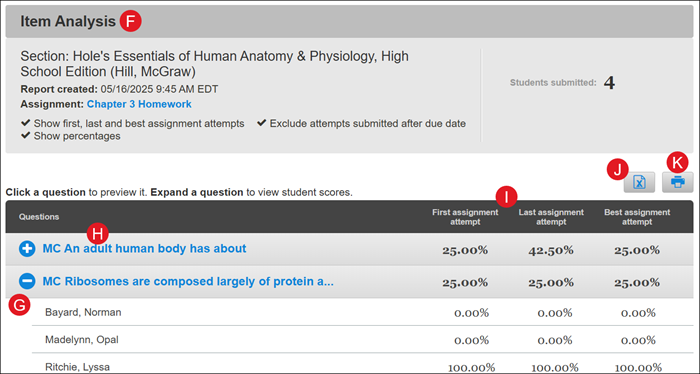
F. The Item Analysis section shows the selected Section, the Report created date, the selected Assignment, and the number of Students submitted.
G. Click the + (plus icon) next to each question to view the list of students and their individual scores for the question.
H. Click on the question to view a preview of it.
I. For each question, you will be able to see the First, Last, and Best assignment attempt for each student.
J. Exporting to Excel – Click the export button to download a Excel file with all of the report details.
K. Print – Click the print button to download/print a PDF version of the report.