K-12 Connect® Teacher Category Analysis Report
Use the Connect® category analysis report to evaluate student performance by category or learning objective.
- AP Connect
- SSO & Manual-Rostering
- Customer Support
- Direct Login & Auto-Rostering
- Reports & Analytics
- Direct Login & Manual-Rostering
- High School
- AP, Honors & Electives
- Classroom Teacher
- SSO & Auto-Rostering
- PreK-12


For a full page view of the demo, click here.
For a Spanish version of the demo, click here.
Article Contents
Access the Category Analysis Report
Access the Category Analysis Report
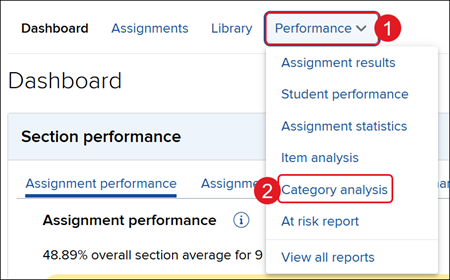
1. Click on the Performance menu.
2. Click on Category analysis from the menu.
Select Report Filters
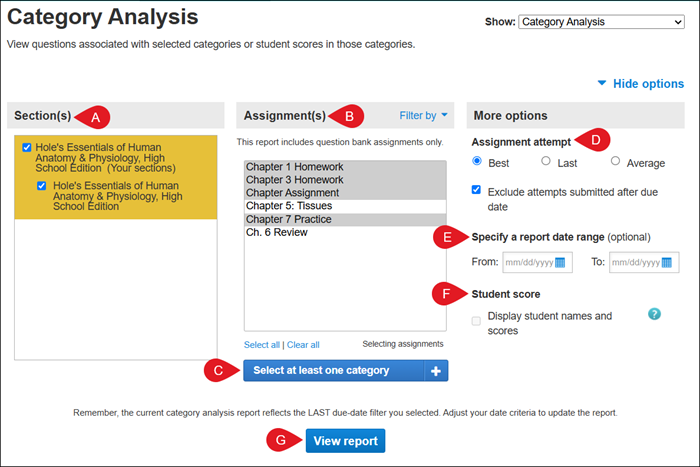
There are a variety of options from which you can choose to customize the report to best fit your needs.
A. Section(s) – Select which sections of your course will be on the report. Choose from the current section, sections within the same course, and secondary instructor’s shared sections (if applicable).
B. Assignment(s) – Select which assignments will be on the report. You can filter assignments by type and select or deselect multiple assignments by using the CTRL or Command keys while clicking assignment names.
C. Select at least one category – Select at least one category to use in order to evaluate students' performance. These categories vary based on what section and assignments you choose. A category or category group is only available when a selected assignment contains a question with content related to this category or group.
D. Assignment attempt – Specify how the student assignment score is calculated and displayed when your students are allowed multiple attempts for an assignment.
Uncheck the box next to Exclude attempts submitted after due date if you want to see submitted student scores after the assignment due date had passed.
E. Specify a report date range – Specify an optional date range for the report. Select a From and To date using the calendar icon.
If you don’t see any scores when you click “View report,” ensure the date range is wide enough to encompass the assignments you wish to view or the entire term.
F. Student score – Choose whether you want to view student scores. You can only select one Assignment from the list if you want to check this option.
G. View report – Click the View report button to run the report based on the filters selected.
View Report
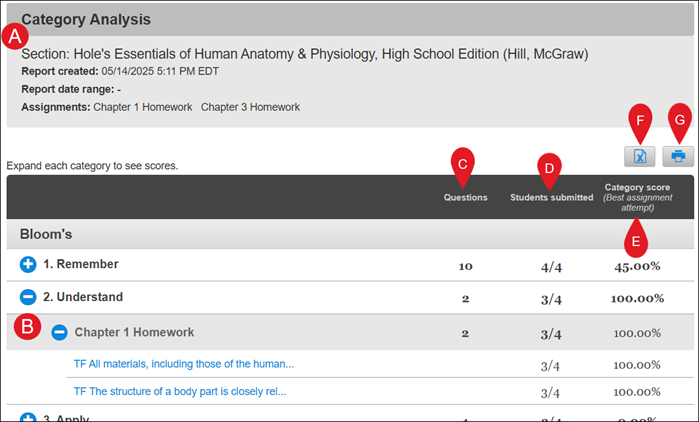
A. Category Analysis – Provides the section you currently are in, the date and time of report creation, the report date range (if selected), and the selected Assignment(s).
B. Click the + (plus icon) next to each section to view the details.
If you only selected one Assignment and check the box next to Student score, you will see the students listed with the score for each row.
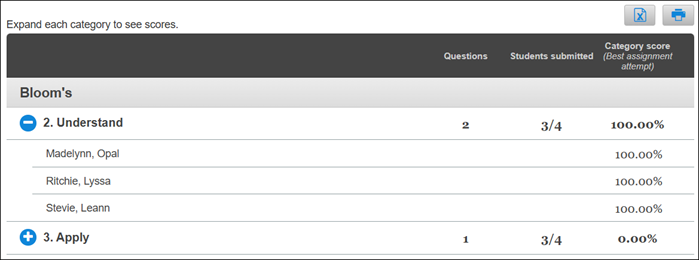
If you selected more than one Assignment, you will see the Assignment name and each associated question. Click the question to preview the question and answer.
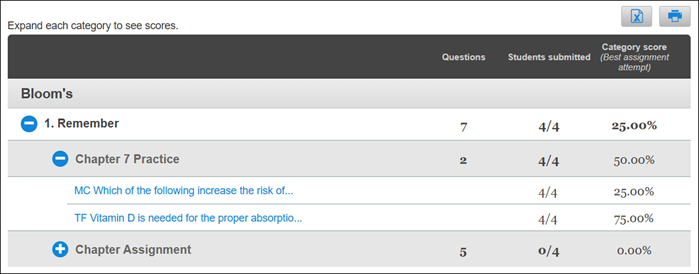
C. Questions – Notes the number of questions for each category and assignment.
D. Students submitted – The number of students who submitted the assignment and the number of students it was assigned to.
E. Category score – The percentage of the best assignment attempt.
F. Exporting to Excel – Click the export button to download a Excel file with all of the report details.
G. Print – Click the print button to download/print a PDF version of the report.
Measured Improvement
The Category Analysis report is the place to go to find out how your students are performing relative to specific learning objectives and goals. Run customized reports on the content in your assignments to determine performance across aspects like learning objectives, difficulty levels, Bloom’s taxonomy categories, and even your own criteria if you’ve taken the time to edit questions in your assignments with individual learning objectives for your course.
It’s an easy way to see how your students performed overall in a category for a particular assignment or across all your assignments. You can even run the report at different times during the semester to see if there’s an improvement over the duration of your course.