How to Capture a HAR File
Learn how to capture a HAR file in your browser to help troubleshoot loading, performance, or login issues with McGraw Hill products.


It often helps development and engineering teams if they have the browser logs (HAR) when troubleshooting an issue. Below are the steps to generate a HAR while reproducing a reported issue. Depending on which browser you are using, there are a few ways to generate a HAR file. Below are instructions for the most common way to obtain a HAR for Google Chrome, Firefox, Microsoft Edge, and Safari.
Browsers
Google Chrome
1. Navigate to the point just before where an error occurs.
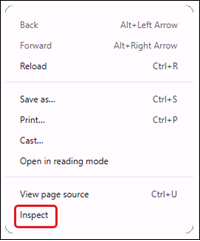
2. Right-click on the page and select Inspect from the menu.
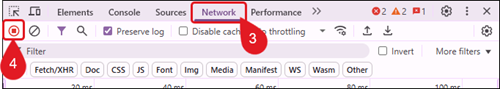
3. Select the Network tab.
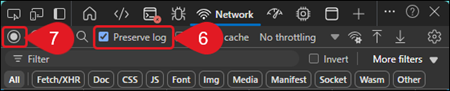
4. Click the Record network log button to turn off the current recording.
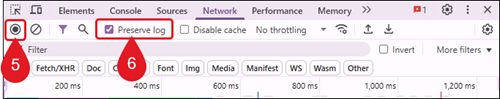
5. Click the Record network log button again to start a new recording of the issue.
6. Check the Preserve Logs option.
7. On the browser page, recreate the steps until you reach the point of the error/issue.
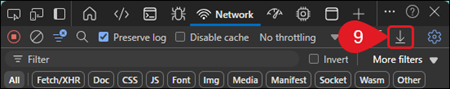
8. Click on the Export HAR (down arrow).
9. Save the HAR to a location on your device and email a copy to our DTS support team.
Firefox
1. Navigate to the point just before where an error occurs.
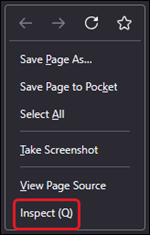
2. Right-click on the page and select Inspect (Q) from the menu.
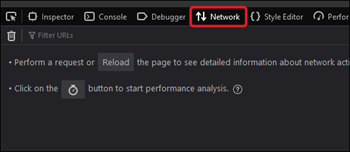
3. Click the Network tab.
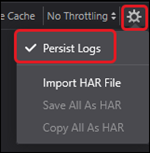
4. To the top right of the console, click the gear icon and select the Persist Logs.
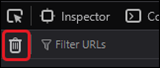
5. Click the trash can icon to the far left of the Network tab.
6. Reproduce the issue while keeping the Network tab open.
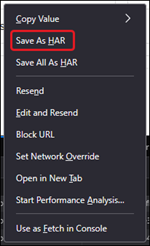
7. After you have reproduced the issue, click the gear icon on the Network tab again and select Save All As HAR from the menu.
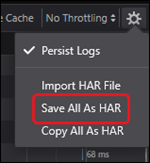
You can also right-click on any line on the Network tab and select Save All As Har from the menu.
8. Save the HAR to a location on your device and email a copy to our DTS support team.
Microsoft Edge
1. Navigate to the point just before where an error occurs.
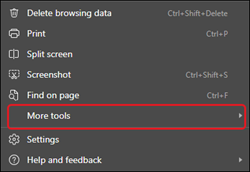
2. Click on the Settings and more icon (three horizonal dots) at the top-right of the browser page.
3. Hover over More tools and select Developer Tools from the menu.
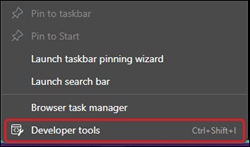
As a shortcut to open the Developer Tools you can Press F12 (all computers) or Ctrl + Shift + I (on Windows).
4. Click on the Network (wireless icon) tab.
5. Click the Record network log button to turn off the current recording.
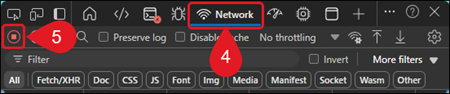
6. Click the Record network log button again to start a new recording of the issue.
7. Check the Preserve Logs option.
8. On the browser page, recreate the steps until you reach the point of the error/issue.
9. Click on the Export HAR (down arrow).
10. Save the HAR to a location on your device and email a copy to our DTS support team.
Safari
1. Navigate to the point just before where an error occurs.
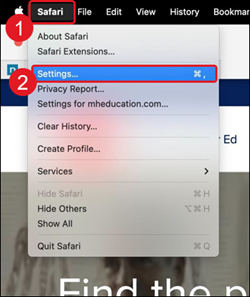
2. Click on Safari in the top navigation menu.
3. Select Settings from the menu.
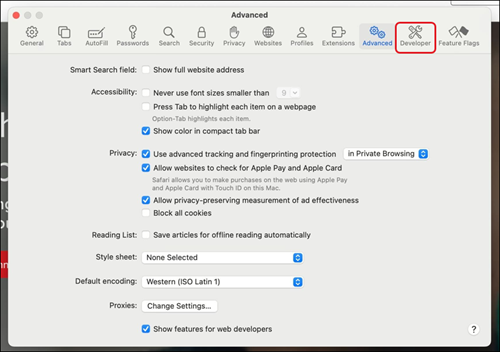
4. Click on Advanced in the top menu.
5. Check the box for Show features for web developers at the bottom.
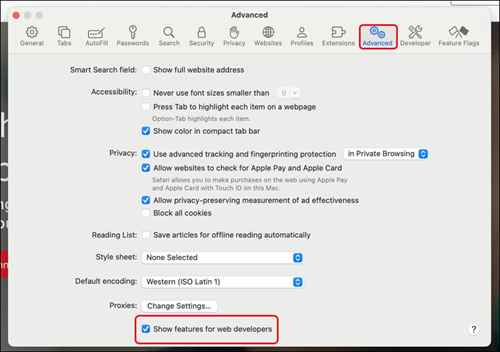
This will add the Developer tab to the Settings menu.
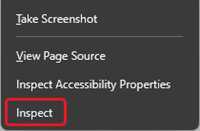
6. On the web page the HAR capture is for, right-click on the page and select Inspect on the menu.
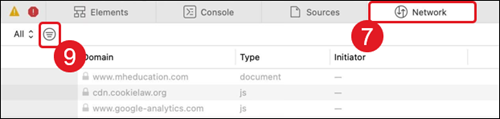
7. Click on the Network tab.
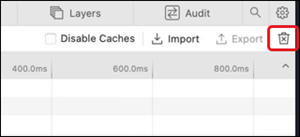
8. Click the trash can icon over to the far right of the Network tab to delete out the current log.
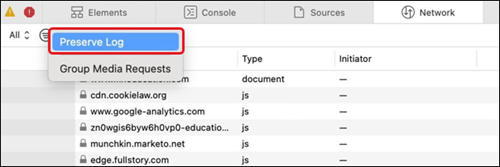
9. Click the three-line icon next to All.
10. Select Preserve Log in the pop-up menu.
11. Once the data has been captured, click on the Export button to the right.
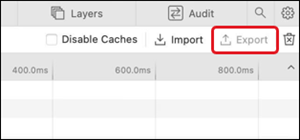
12. Save the HAR to a location on your device and email a copy to our DTS support team.