How to Capture a Console Log File
Capture a browser console log file to help troubleshoot technical issues.
- SSO & Manual-Rostering
- Customer Support
- Direct Login & Auto-Rostering
- School Student
- Middle School
- Troubleshooting
- Direct Login & Manual-Rostering
- High School
- Classroom Teacher
- School Parent
- SSO & Auto-Rostering
- PreK-12
- School Administrator
- Preschool
- Elementary School
- AP Biology
- AP Chemistry
- AP History & Geography
- AP Psychology
- AP Economics
- AP African American Studies
- AP Precalculus
- AP Statistics
- AP Computer Science
- AP Language and Composition
- AP Public Speaking
- AP Music Theory
- 5 Steps to a 5 - AP Test Prep
- Glencoe Health 2022
- Teen Health 2021
- Arrive Math
- Building Blocks 2024
- Building Blocks PreK 2025
- Number Worlds 2024
- SRA Reading Laboratory 2025
- SRA Reading Mastery Transformations
- Achieve3000 Literacy
- Actively Learn
- McGraw Hill Literacy Emerge!
- McGraw Hill Literacy Summit!
- McGraw Hill Literacy Soar!
- Open Court Reading 2025
- Redbird
- StudySync 2021
- ALEKS
- ALEKS Adventure
- CA Reveal Math (K-12)
- Illustrative Math
- Redbird Math
- Reveal Math (K-12)
- Texas Math
- CA Inspire Science 2020
- FL Science 2025 (K-12)
- Inspire Science 2020
- TN Science (K-12)
- TX Science 2025 (K-12)
- CA Impact 2019
- FL Social Studies 2024 (K-12)
- Impact Social Studies
- McGraw Hill Social Studies
- All Sorts 2026 (K-5)
- Asi se Dice 2024
- CTE - Health Science
- CTE - Agriculture
- CTE - Computing and Technology
- CTE - Culinary Arts
- CTE - Early Childhood Education
- CTE - Business, Marketing, and Finance
- CTE - Criminal Justice
- Glencoe Health 2014
- McGraw Hill Health 2014
- 2Inform
- Building Blocks 2015
- Connecting Math Concepts
- Number Worlds 2015
- Corrective Reading
- Early Interventions in Reading
- Spelling Mastery
- WonderWorks 2022 & 2014
- Maravillas 2020 & 2017
- OCR Foundational Skills Kit
- OCR Word Analysis Kit
- Open Court Reading 2016, 2018, 2023
- StudySync 2015 & 2017
- Wonders
- Wonders 2014
- Wonders 2023 2020 2017
- Wonders Balanced Literacy 2016
- Wonders EL 2016
- World of Wonders 2017
- Core Plus Math 2015
- Everyday Mathematics 4 (K-6)
- Glencoe Algebra 1 2014
- Glencoe Algebra 2 2014
- Glencoe Algebra 1 2018
- Glenoce Algebra 2 2018
- Glencoe Math
- Glencoe Geometry 2014
- Glencoe Geometry 2018
- Glencoe Math Course 1
- Glencoe Math Course 2
- Glencoe Math Course 3
- Glencoe Math Accelerated
- McGraw Hill My Math
- McGraw Hill My Math 2013 & 2016
- McGraw Hill My Math 2018
- Pre-Algebra 2012
- Glencoe Science
- Glencoe Science 2017
- Inspire Science 2017
- iScience 2017
- Networks
- Networks 2014 (K-5)
- Networks 2018
- Networks 2014 & 2016
- Music! Its Role
- Spotlight on Music
- Asi se Dice 2016


It often helps development and engineering teams if they have the console logs when troubleshooting an issue. Below are the steps to generate a Console Log file while reproducing a reported issue. Depending on which browser you are using, there are a few ways to generate a Console Log file. Below are instructions for the most common way to obtain a Console Log file for Google Chrome, Firefox, Microsoft Edge, and Safari.
Browsers
Google Chrome
1. Navigate to the point just before where an error occurs.
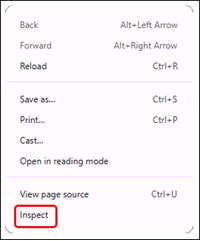
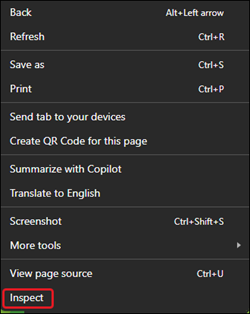
2. Right-click on the page and select Inspect from the menu.
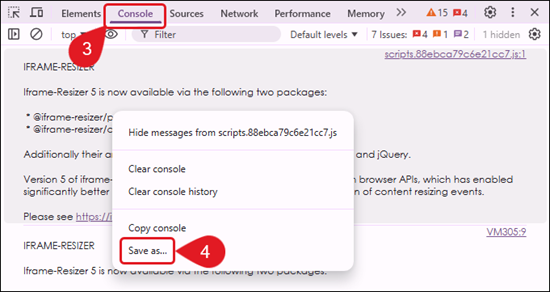
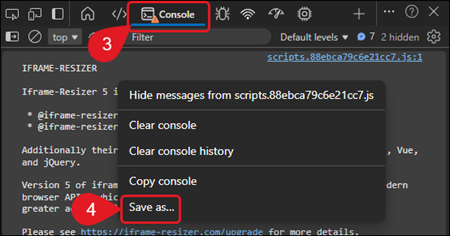
3. Click the Console tab.
4. Right-click anywhere in the console panel and select Save as... from the menu.
5. Select the preferred file location on your device and click the Save button.
Firefox
1. Navigate to the point just before where an error occurs.
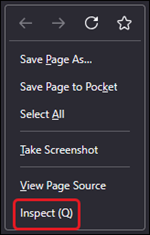
2. Right-click on the page and select Inspect (Q) from the menu.
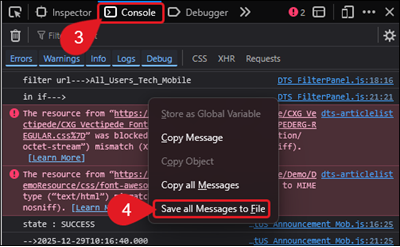
3. Click on the Console tab.
4. Right-click anywhere in the console panel and select Save all Messages to File from the menu.
5. Select the preferred file location on your device and click the Save button.
Microsoft Edge
1. Navigate to the point just before where an error occurs.
2. Right-click on the page and select Inspect from the menu.
3. Click the Console icon.
4. Right-click anywhere in the console panel and select Save as... from the menu.
5. Select the preferred file location on your device and click the Save button.
Safari
1. Navigate to the point just before where an error occurs.
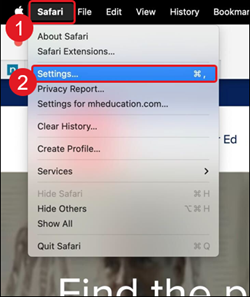
2. Click on Safari in the top navigation menu.
3. Select Settings from the menu.
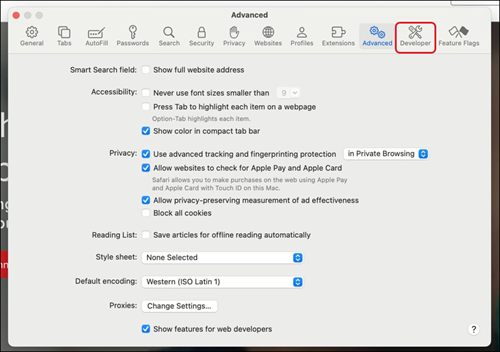
4. Click on Advanced in the top menu.
5. Check the box for Show features for web developers at the bottom.
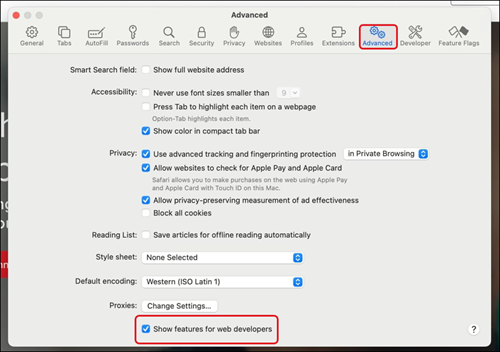
This will add the Developer tab to the Settings menu.
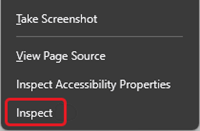
6. On the web page the HAR capture is for, right-click on the page and select Inspect on the menu.
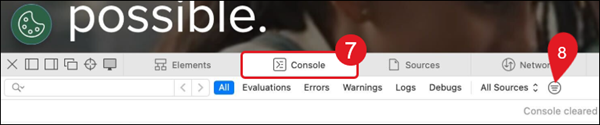
7. Click the Console tab.
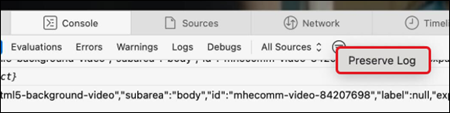
8. Click on the menu button to the right of All Sources and checkmark the Preserve Log box on the pop-up menu.
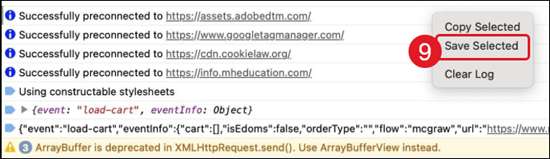
9. Right-click anywhere in the console panel and select Save Selected from the menu.
10. Select the preferred file location on your device and click the Save button.