Classic ALEKS Adventure Administrator Time & Topic Reports
Review the ALEKS Adventure administrator Time and Topic report to analyze student activity and focus areas.
- PreK-12
- Customer Support
- School Administrator
- Elementary School
- Direct Login & Auto-Rostering
- Direct Login & Manual-Rostering
- SSO & Auto-Rostering
- SSO & Manual-Rostering
- Supplemental
- Math
- ALEKS Adventure
- Reports & Analytics


The Time & Topic Report allows you to monitor the amount of time a student is spending within the ALEKS Knowledge Checks and Learning Mode. It also includes the number of topics a student has attempted over a particular period of time and how many of those topics the student has learned.
Article Contents
Access Time & Topic Report
1. SSO or sign in to your Admin account at my.mheducation.com
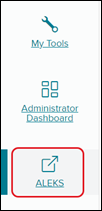
2. Launch ALEKS from your left-side navigation menu in your admin tools.
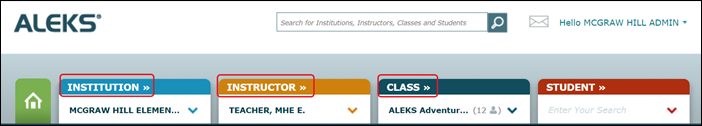
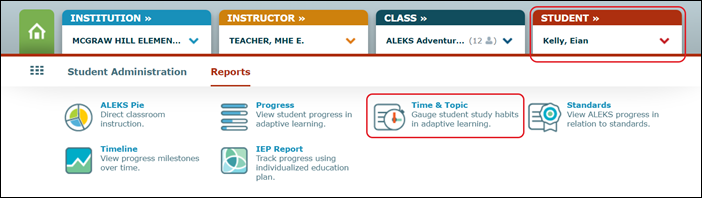
3. Select your Institution, Instructor, and Class.
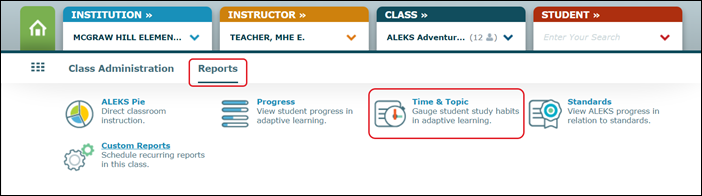
4. Hover over Reports and click Time & Topic from the menu.
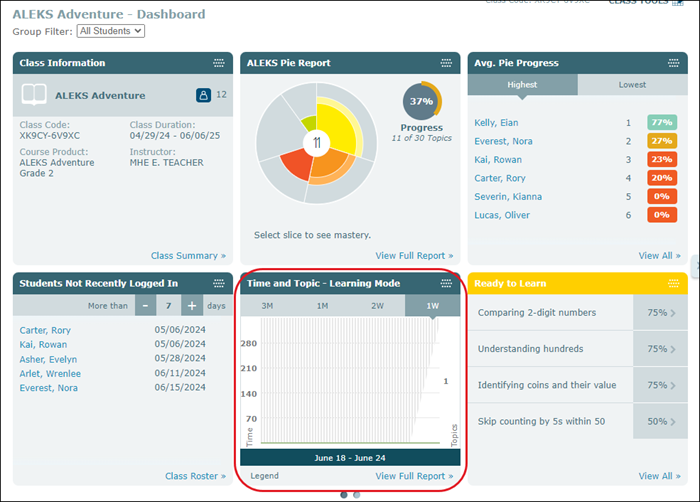
You can also access this report from your ALEKS dashboard after selecting a class.
Class Time & Topic Report
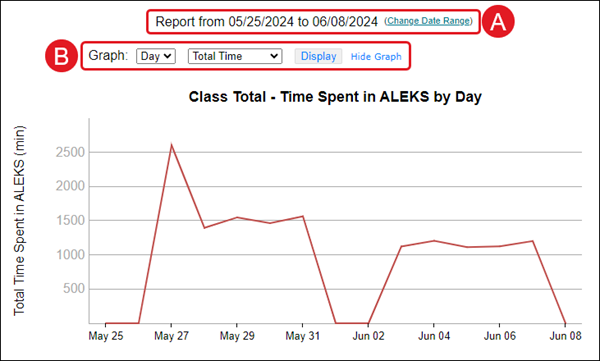
A. The Time & Topic Report default view is shown as one week, ending on the current day's date. You can change the date range to show results for a different period of time.
B. The graph view can be changed to show time or topic information for the date range at a glance. The graph can also be hidden to maximize the view of the detailed information at the bottom of the page.
The Time & Topic Report at the class level has a column that shows what each student has accomplished during the selected date range, and then breaks the information down to show what happened each day during that time.
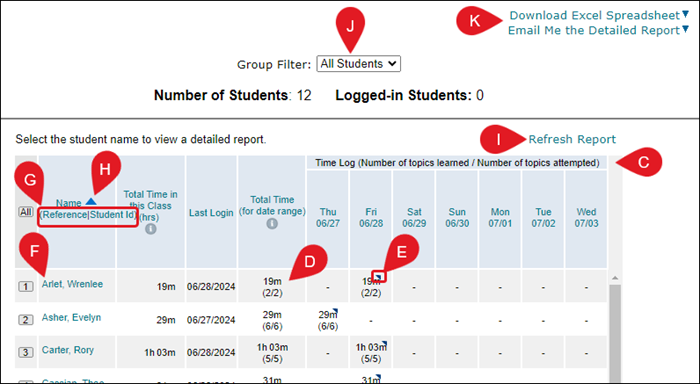
C. Each student is listed with data showing the total time in Class, their Last Login date, their Total Time in the program for the selected date range, and is then separated into each day for the selected date range.
D. The time shown for each time column is in hours and minutes. The numbers in the parentheses below the time are the number of topics learned out of the number of topics attempted.
E. A triangle in the corner of the daily time entry indicates that the student spent all or part of that day working on a knowledge check.
F. Click on a student Name to be directed to their specific Time & Topic report.
G. Click on the Reference or Student ID link to view the student by that option instead of by their name.
H. Click on a header option to sort the data by that option.
I. Click the Refresh Report link to gather the latest data for the selected date range.
J. Select a Group Filter option to filter by a specific created group.
K. Click the Download Excel Spreadsheet or Email Me the Detailed Report to transfer the data into an Excel file.
Student Time & Topic Report
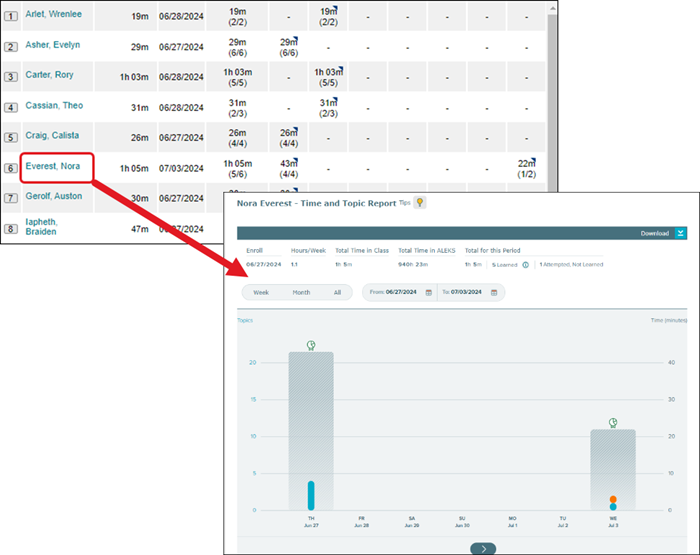
To access the Time & Topic Report for a student, click on the student's name in the class-level report.
You can also select a student from the Student drop menu and then select the Time & Topic Report from the Report menu.
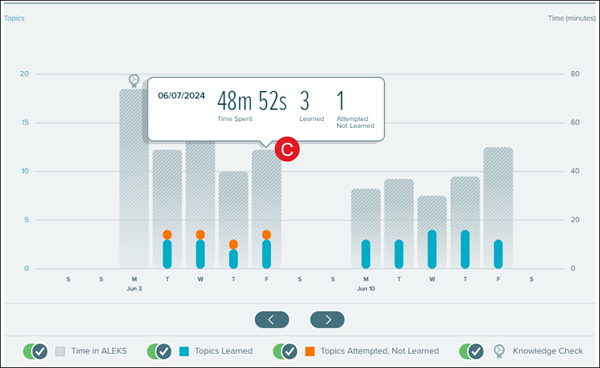
This report provides a daily breakdown of ALEKS usage. The view can be adjusted to a weekly, monthly, or cumulative view or a specific range. The height of the bar represents the total login time. A helpful key is located below the graph.
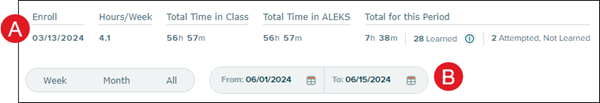
A. The individual student Time & Topic report shows the date of the student's enrollment, the hours per week they have spent in the program, the total time they have spent in the program for the class, and within ALEKS, and the total time spent in the program based on the date range selected.
B. Click Week, Month, or All, or select a date range to filter down the data.
C. Hover over a bar to see how much time was spent and the number of topics attempted and learned on a given day.
D. Select a bar to view the Learning Sequence Log for that day, which shows the sequence of actions followed to learn the topic, including the exact problems practiced and the answers entered.
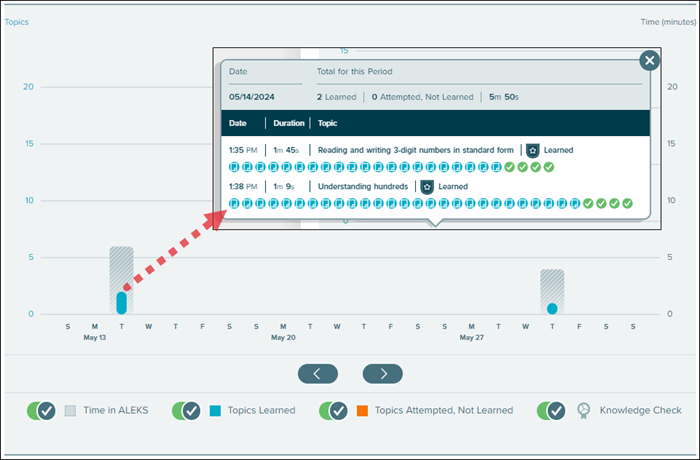
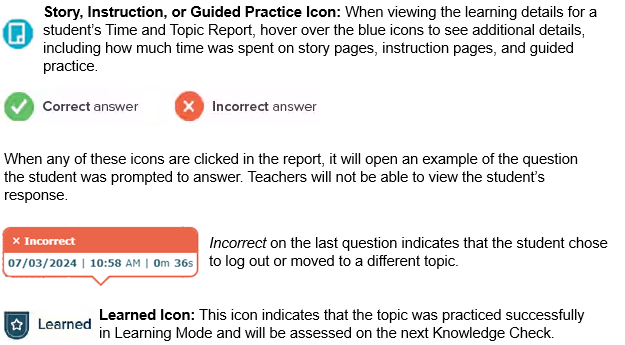
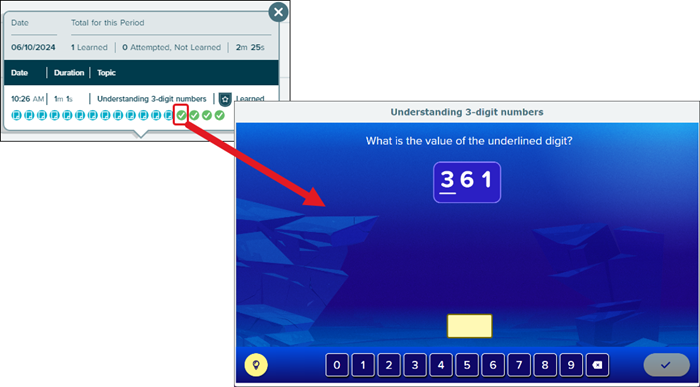
The Learning Sequence Log provides specific information about a student's work in ALEKS, including data about topic attempts and outcomes, time spent, time stamps on attempts, and overall topic areas, and also specifics on problems presented and answers submitted.
Hover over a Problem Icon for details, and then click to see the question, the answer, and the answer the student submitted.
Report Icon Key