Classic ALEKS Adventure Administrator Progress Reports
Analyze ALEKS Adventure administrator Progress reports to monitor class and student growth.
- PreK-12
- Customer Support
- School Administrator
- Elementary School
- Direct Login & Auto-Rostering
- Direct Login & Manual-Rostering
- SSO & Auto-Rostering
- SSO & Manual-Rostering
- Supplemental
- Math
- ALEKS Adventure
- Reports & Analytics


The ALEKS Progress Report shows overall student progress in both Learning Mode and Assessment Mode, as well as average learning rates. They can be used to monitor progress and identify students who could benefit from intervention by comparing data points.
Article Contents
Access Progress Report
1. SSO or sign in to your Admin account at my.mheducation.com
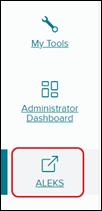
2. Launch ALEKS from your left-side navigation menu in your admin tools.
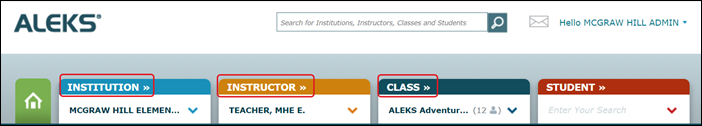
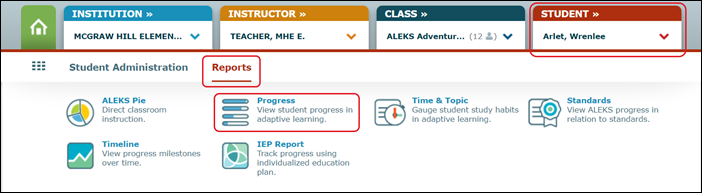
3. Select your Institution, Instructor, and Class.
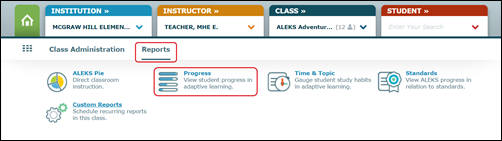
4. Hover over Reports and select Progress from the drop menu.
Class Progress Report
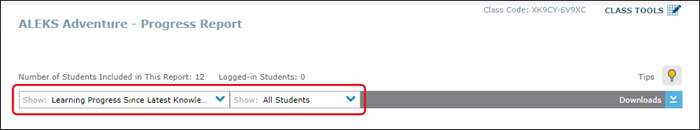
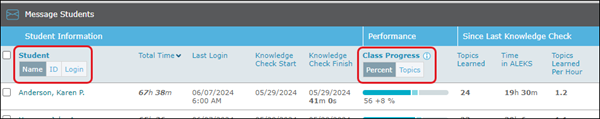
The view of progress data is automatically set to Learning Progress Since Latest Knowledge Check. Click on the Show: All Students drop-down to view the data for a specific group of students.
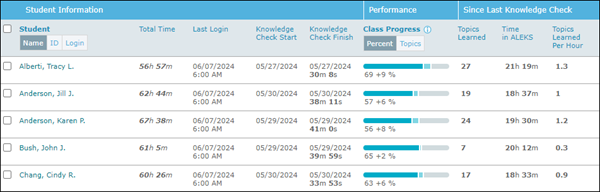
The Performance and Learning data sections under each view show the student's current progress and average learning rates.
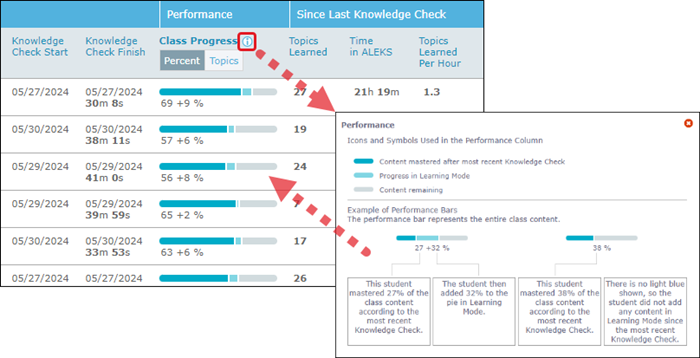
Click the information icon to show a key that illustrates what the different parts of the bar represent. The information provided in the key will vary based on the view selected.
Click on any of the header links to sort by that option. Ex: Clicking Total Time will resort to the list based on the total time the students have been in the program.
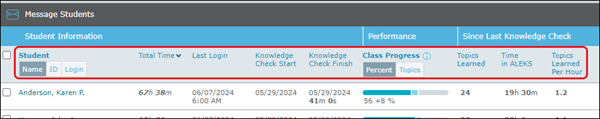
Click on Name, ID, or Login under Student to view the student list by that option. Click Percent or Topics to view the Class Progress by that option.
Student Progress Report
Click on the student's Name, ID, or Login in the Student list to open their individual progress report.
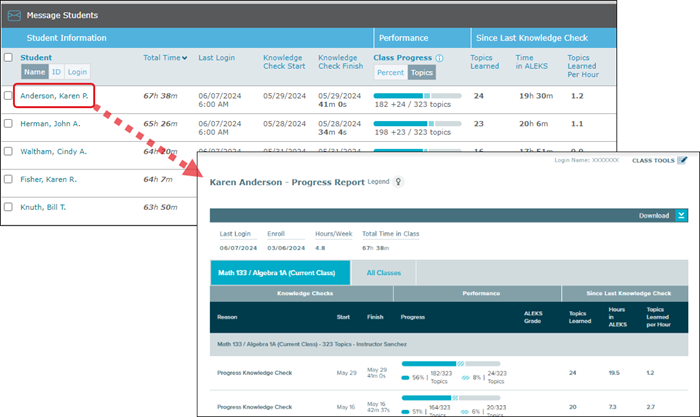
You can also select a student from the Student drop-down at the top of the page and then select Progress from the Reports menu.
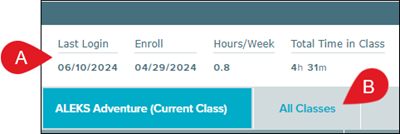
A. The student progress report will show you their Last Login date, when they were enrolled into the class, how many hours per week they are in the program, and the total time they have spent in the program for the class.
B. If they are enrolled in more than one ALEKS class, you can toggle between only viewing data for the selected class, or viewing combined data for all of the classes they are assigned to.
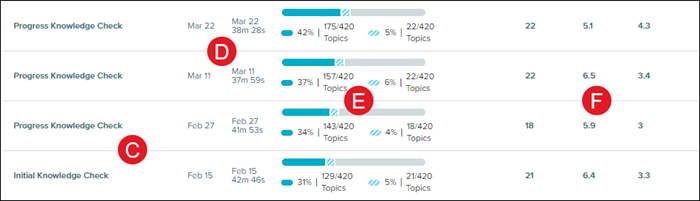
C. The student's progress report will show data for their Initial Knowledge Check and each of the Progress Knowledge Checks
they've completed.
D. The date the student started and finished the Knowledge Check will be listed for each.
E. The bar graph shows the same as it does when viewing the data as a whole class. The dark blue represents content mastered based on the Knowledge Check, while the light blue represents progress the student has made in Learning Mode. The gray represents the content remaining.
F. The three far-right columns represent the Topics Learned, Hours spent within ALEKS, and the Topics Learned per Hour.