Teacher Activity Performance Reports
Use the new activity performance report to evaluate student engagement and results by activity.
- Customer Support
- PreK-12
- Classroom Teacher
- Preschool
- Elementary School
- Middle School
- High School
- Direct Login & Auto-Rostering
- Direct Login & Manual-Rostering
- SSO & Auto-Rostering
- SSO & Manual-Rostering
- Core
- Intervention
- Supplemental
- AP, Honors & Electives
- Career & Technical Education
- Literacy
- Math
- Science
- Social Studies
- Health
- Visual & Performing Arts
- World Languages
- AP Biology
- AP Chemistry
- AP History & Geography
- AP Psychology
- AP Economics
- AP African American Studies
- AP Precalculus
- AP Statistics
- AP Computer Science
- AP Language and Composition
- AP Public Speaking
- AP Music Theory
- 5 Steps to a 5 - AP Test Prep
- Glencoe Health 2022
- Teen Health 2021
- Arrive Math
- Building Blocks 2024
- Building Blocks PreK 2025
- Number Worlds 2024
- SRA Reading Laboratory 2025
- SRA Reading Mastery Transformations
- McGraw Hill Literacy Emerge!
- McGraw Hill Literacy Summit!
- McGraw Hill Literacy Soar!
- Open Court Reading
- Open Court Reading 2025
- Open Court Reading 2016, 2018, 2023
- CA Reveal Math (K-12)
- Illustrative Math
- Reveal Math (K-12)
- CA Inspire Science 2020
- FL Science 2025 (K-12)
- Inspire Science 2020
- TN Science (K-12)
- TX Science 2025 (K-12)
- CA Impact 2019
- FL Social Studies 2024 (K-12)
- Impact Social Studies
- McGraw Hill Social Studies
- Asi se Dice 2024
- CTE - Business, Marketing, and Finance
- CTE - Health Science
- CTE - Computing and Technology
- CTE - Agriculture
- CTE - Culinary Arts
- CTE - Early Childhood Education
- CTE - Criminal Justice
- Texas Math
- Level Up K–5
- Level Up 6–8
- Level Up 9–12
- Reports & Analytics


View the demo in a separate tab.
View the Spanish version of the demo.
Article Contents
Access Activity Performance Reports
- SSO or sign in at my.mheducation.com.
- Launch your Open Learning course.
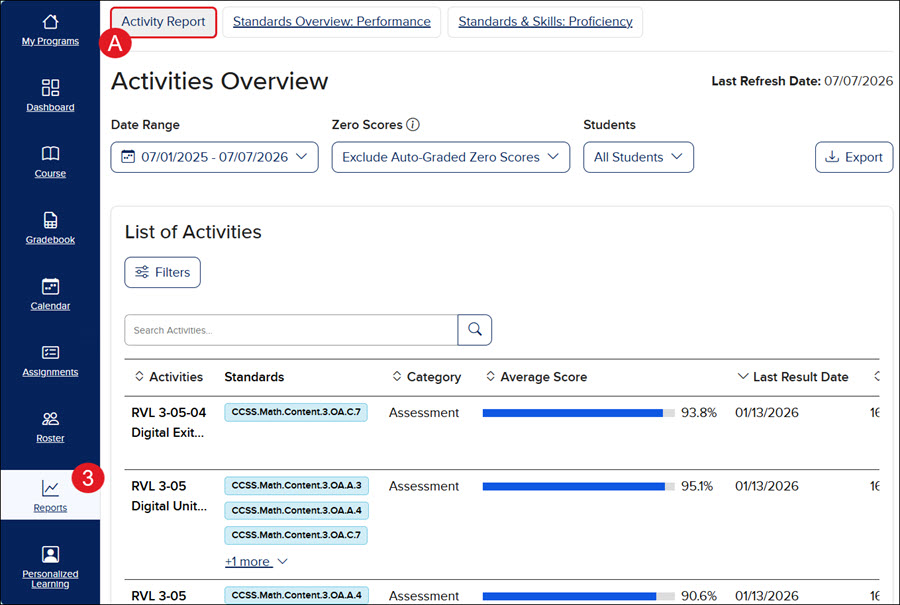
- Click on Reports from the navigation menu.
A. The Activities Overview will automatically launch. If you are on a different report, you can click on the Activity Report button at the top of the page.
Activity Overview
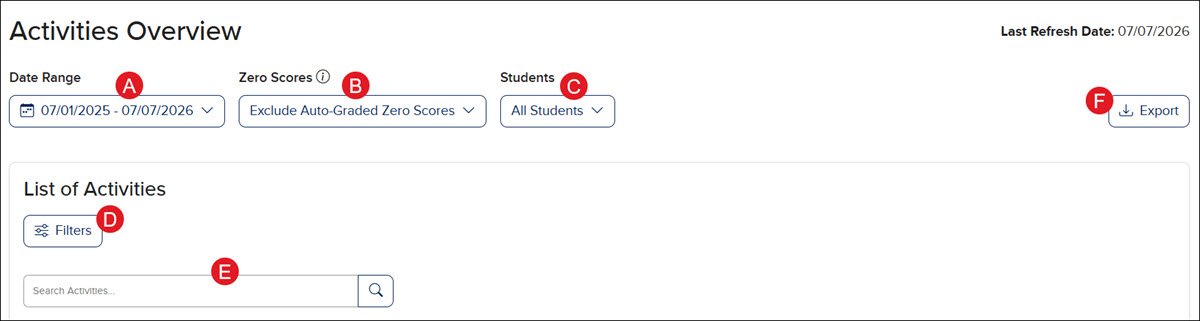
- Click on the Date Range drop-down to view the School year to date (July 1st is considered the first day of school), Last Day, Last 7 Days, Last 30 Days, or a Custom range of dates for the data provided.
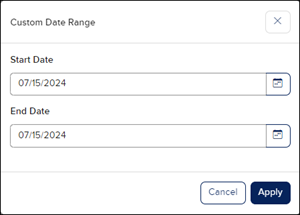
- If you select Custom, select the range of dates you want to filter the data for on the Custom Date Range pop-up and click the Apply button.
- Click the Zero Scores drop-down to select Exclude Auto-Graded Zero Scores or Include Auto-Graded Zero Scores in the report view. The default is set to exclude the zero scores. Students who submitted assignments but scored zero will still appear in the reports.
- Click the Students drop-down to select a specific student to view data for.
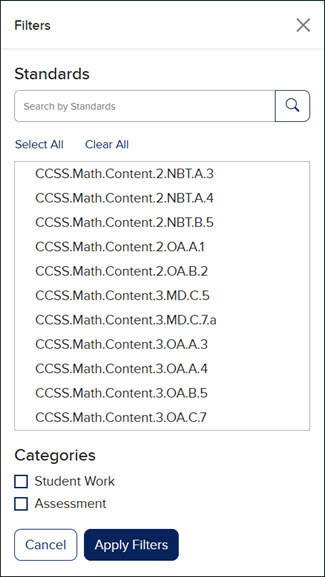
- Click the Filters button to open the Activities Filters panel to select to view a certain standard and/or category.
- To view a specific activity, enter the activity name in the Search Activities field.
- Click the Export button to download a CSV file of the report.
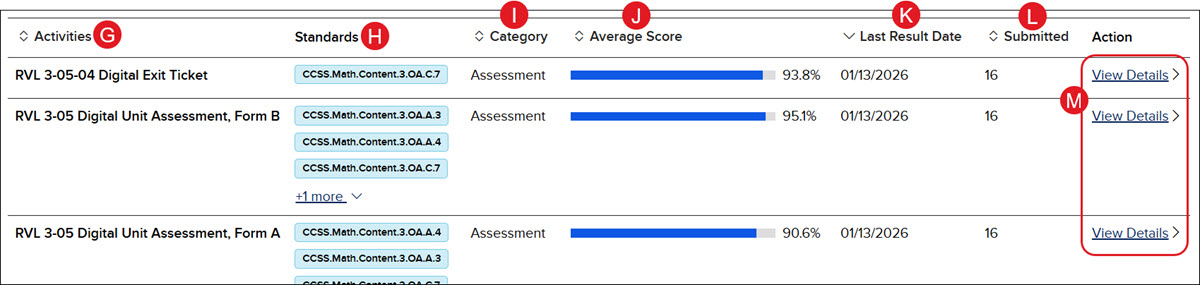
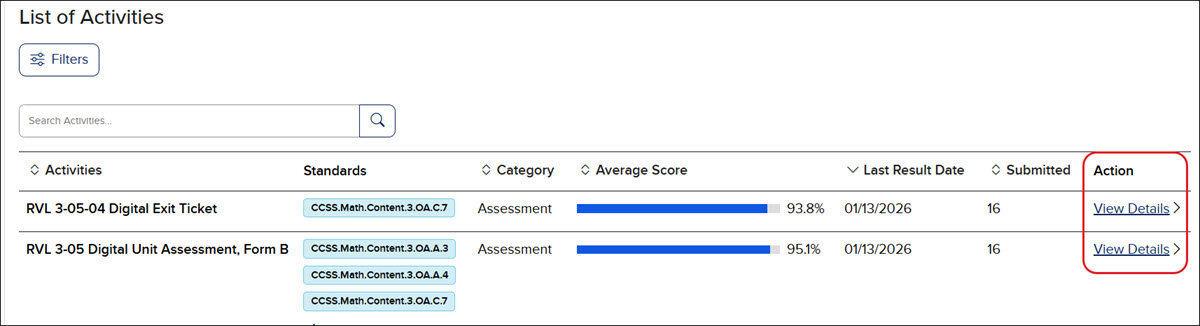
- The Activities list provides all of the assignments and assessments students have completed for the class.
- If any standards are associated with the activity, they will be listed in the Standards column.
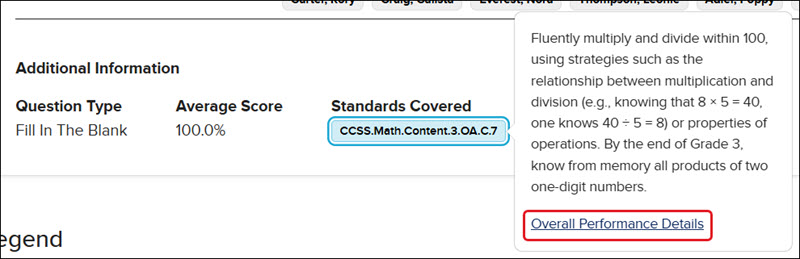
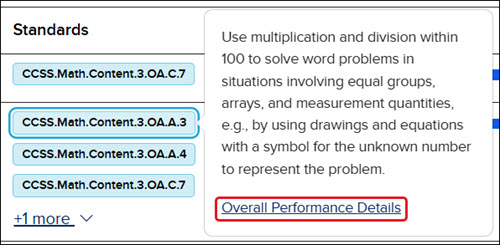
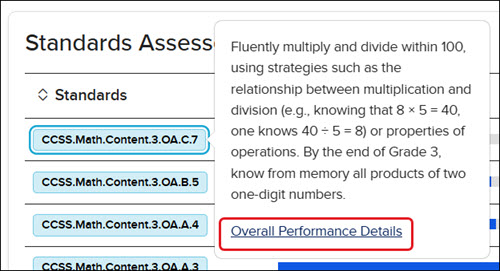
Click on an associated standard to view the description. Click the Overall Performance Details link on the pop-up to navigate to the Standards Overview: Performance report.
- The Category column lists the type of activity.
- The Average Score shows the overall percentage for the class for that activity.
- The Last Result Date is the date on which the activity was last submitted by students.
- The Submitted column shows how many students submitted that activity.
- The Action column contains the View Details link that will navigate you to the activity Summary and Question Analysis.
Activity Summary
On the Activities Overview page, click the View Details link in the Actions column to the right of an activity to navigate to the Summary page for the activity.
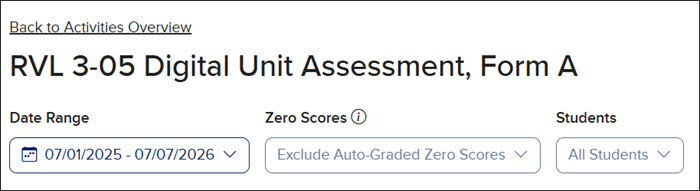
The Zero Scores and Students drop-downs will be grayed out on the Summary page. To adjust these selections, click the Back to Activities Overview link and make the changes before navigating back to the Summary page.
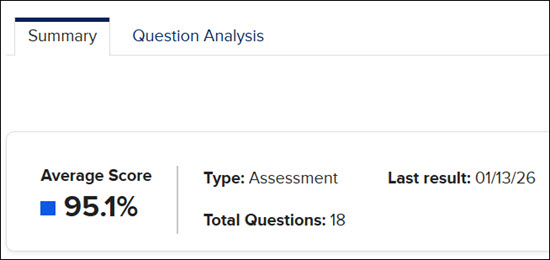
On the Summary tab, teachers can view the Average Score for the activity, the Type of activity that was selected, the Total Questions included in the activity, and the Last result date.
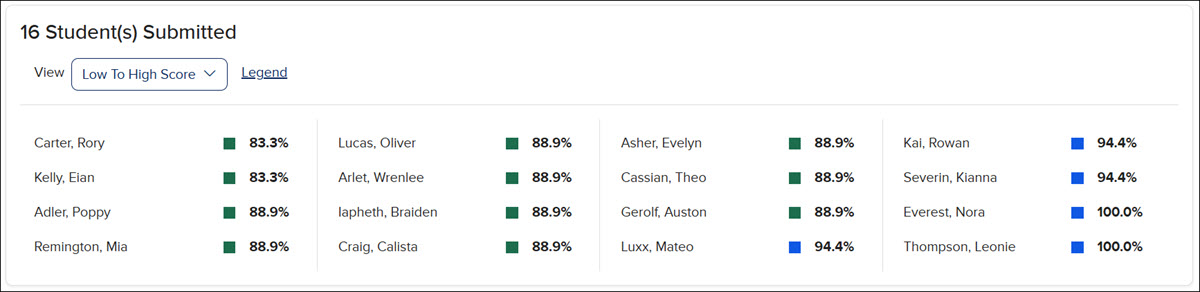
In the Submitted section, teachers can view a breakdown of student percentages for the activity. Click the View drop-down to arrange the list in the preferred manner.
In the Standards Assessed section, if there are standards associated with the activity, they will be listed in this section with the average class percentage for each standard.
It also provides the questions in which the standards are associated. Click on a question number to navigate to that question on the Question Analysis tab.
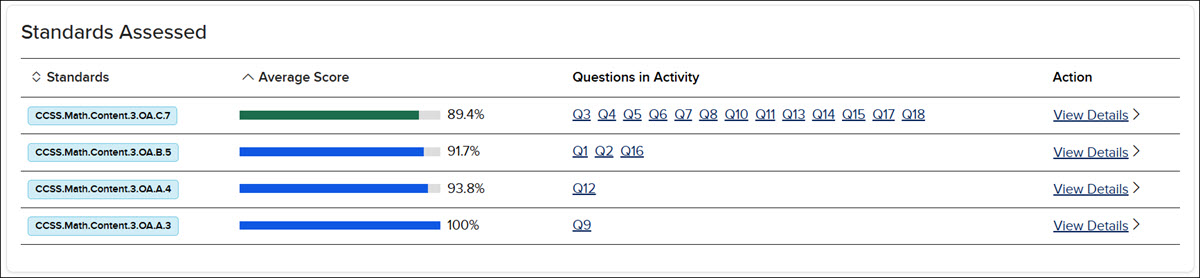
Click on an associated standard to view the description. Click the Overall Performance Details link on the pop-up to navigate to the Standards Overview: Performance report.
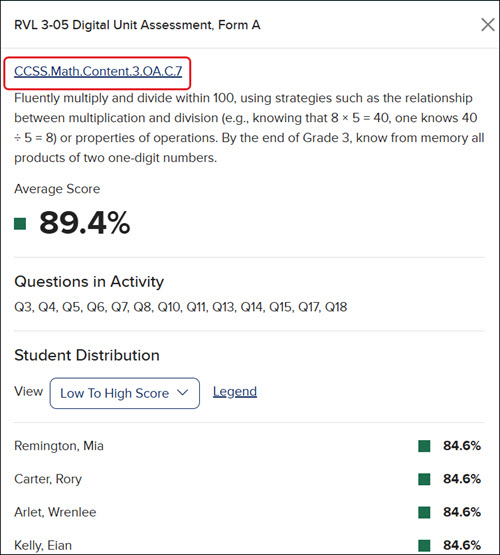
Click the View Details link in the Action column to the right of the standard to open a panel to view a student breakdown of that standard.
The panel includes each student who submitted the assignment and the percentage of their answer for that standard. Click on the standard link at the top of the panel to navigate to the Standards Overview: Performance report.
Question Analysis
Click on the Question Analysis tab to view the average score for each question in the activity. Hover over each question in the bar graph to view the Average Score per Question in a pop-up.
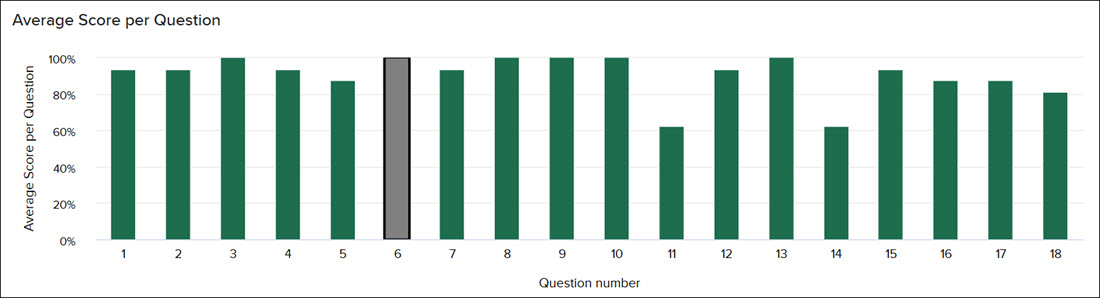
Below the bar graph teachers can view the Question Details. The details include the question the students answered and Student Responses. In the Student Responses section, teachers can view how many students selected a specific answer, and who those students are.
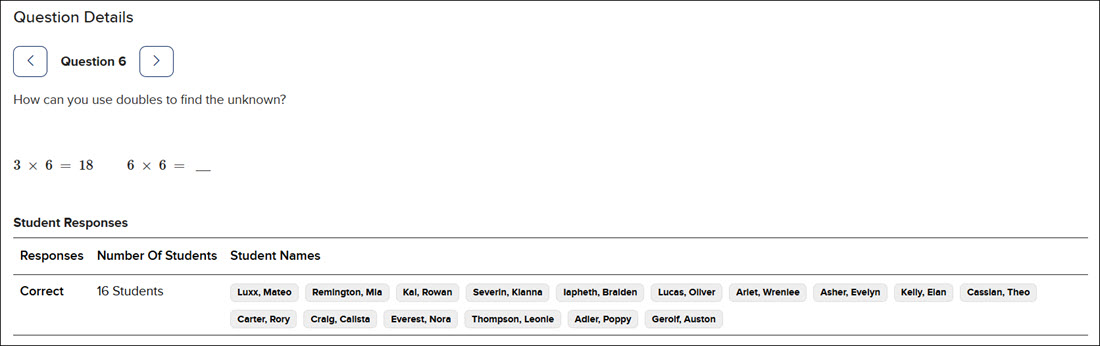
In the Additional Information section at the bottom, teachers can view the Question Type, Average Score for the activity, the Cognitive Levels, and the Standards Covered.
Click on an associated standard to view the description. Click the Overall Performance Details link on the pop-up to navigate to the Standards Overview: Performance report.