Achieve3000 Literacy - Data Center
Explore the Achieve Literacy Data Center for detailed reports, analytics, and instructional insights.
Tags
Supplemental
Getting Started & Orientation
Literacy
SSO & Manual-Rostering
Customer Support
Direct Login & Auto-Rostering
Reports & Analytics
Middle School
Direct Login & Manual-Rostering
High School
Classroom Teacher
SSO & Auto-Rostering
PreK-12
Preschool
Achieve3000 Literacy
Elementary School


The Data Center is capable of displaying a variety of useful information at-a-glance. Teachers can review their students' completed activities, average scores, and Lexile records - including year-to-date lexile progress.
Data Center
Data Center Filters
Dashboard
Class Overview
The Data Center can be accessed in two ways:
By clicking on the Data Center icon at the top of the Teacher Dashboard

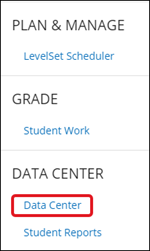
Or by opening the Side Menu, and selecting Data Center from the menu.
The Data Center will then open to the Dashboard where you can use the provided filters to generate data for your students and classes.
Click the Apply button to save the filter options.
Click on the Filtering and Grouping filter to select options such as viewing information in the Data Center based on the activity in the class, class membership, by language, and by activity type.
Click the Apply button to save filter options.
Click the Date Range filter to select a different date range to display different information in the Data Center.
Click the Apply button to save filter options.
Use the Export and Print options to save the current data view based on your filter selections.
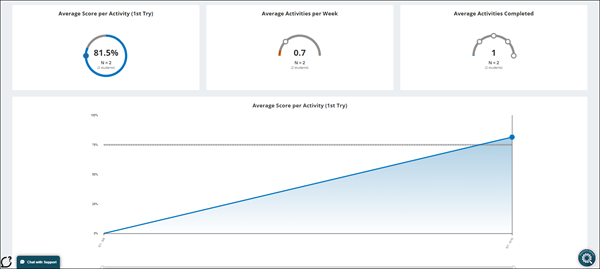
On the top half of the Dashboard page will show the data for Activities completed by your students.
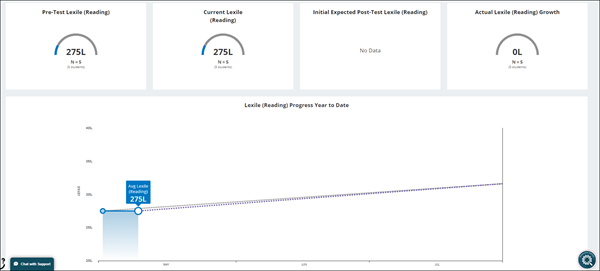
The bottom half of the Dashboard page will show the data for student Lexile levels.
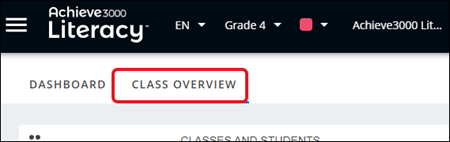
Click the Class Overview tab at the top of the Data Center page to view more in-depth data for the selected class(es) and student(s).
In addition to the filters mentioned above, the Class Overview page has a few additional filters you can use to narrow down the data you're viewing.
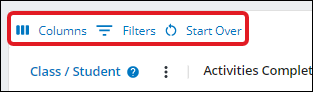
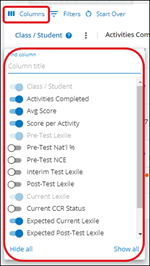
Select the Columns option to add or remove which columns you want to view data for.
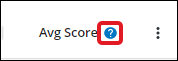
Based on the Column selections made, some of the columns also have the option to view additional details as to what data or information the column provides. You can view this additional information by clicking on the question mark icon beside the column header.
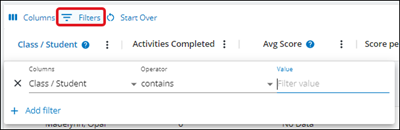
Select the Filters option to narrow down the data view further. This is helpful if you are wanting to view only a certain student's data.
Sections Covered:
Data Center
Data Center Filters
Dashboard
Class Overview
Accessing the Data Center
The Data Center can be accessed in two ways:
By clicking on the Data Center icon at the top of the Teacher Dashboard
Or by opening the Side Menu, and selecting Data Center from the menu.
The Data Center will then open to the Dashboard where you can use the provided filters to generate data for your students and classes.
Data Center Filters
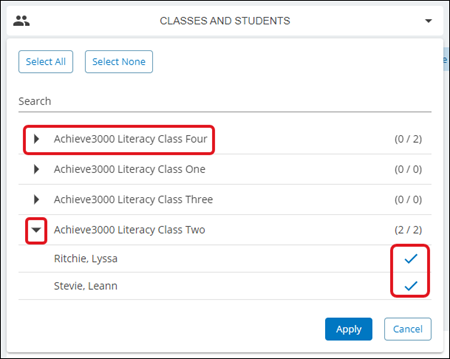
Click on the Classes and Students filter to select certain classes and/or students to view in the Data Center. You can click the class name to select all students associated with that particular class. Or you can click the arrow next to the class name to display the students in that class, then click on the student names you want to view in the Data Center.Click the Apply button to save the filter options.
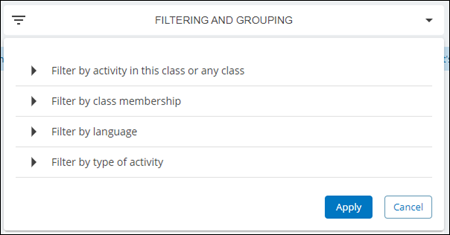
Click on the Filtering and Grouping filter to select options such as viewing information in the Data Center based on the activity in the class, class membership, by language, and by activity type.
Click the Apply button to save filter options.
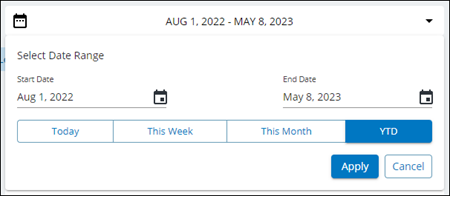
Click the Date Range filter to select a different date range to display different information in the Data Center.
Click the Apply button to save filter options.
Use the Export and Print options to save the current data view based on your filter selections.
Dashboard
The Dashboard provides high-level information about Activity completion and Lexile data. Using the filters at the top of the page, you can determine the data that will be displayed on this page. The various sections of the page will populate based on your selected filters, with Activity data in the top sections and Lexile Data on the bottom.On the top half of the Dashboard page will show the data for Activities completed by your students.
The bottom half of the Dashboard page will show the data for student Lexile levels.
Class Overview
The Class Overview provides more detail about your students' data. You can use the selectors to pull information for a specific class, small group, or even for an individual student. Some of that data includes the Lexile levels the student(s) received for the pre-, interim-, and post-test, their current Lexile level, and their expected Lexile level.Click the Class Overview tab at the top of the Data Center page to view more in-depth data for the selected class(es) and student(s).
In addition to the filters mentioned above, the Class Overview page has a few additional filters you can use to narrow down the data you're viewing.
Select the Columns option to add or remove which columns you want to view data for.
Based on the Column selections made, some of the columns also have the option to view additional details as to what data or information the column provides. You can view this additional information by clicking on the question mark icon beside the column header.
Select the Filters option to narrow down the data view further. This is helpful if you are wanting to view only a certain student's data.