Navigating the Achieve3000 Literacy Data Center
Explore the Achieve3000 Literacy Data Center for detailed reports, analytics, and instructional insights.
- Customer Support
- PreK-12
- Classroom Teacher
- Elementary School
- Middle School
- High School
- Direct Login & Auto-Rostering
- Direct Login & Manual-Rostering
- SSO & Auto-Rostering
- SSO & Manual-Rostering
- Supplemental
- Literacy
- Achieve3000 Literacy
- Reports & Analytics


The Data Center continues to evolve as the central place for teachers to monitor student performance and Lexile progress. It includes data for college and career readiness, multiple LevelSet data points, and invalid activities indicators. Teachers can also customize the columns and information contained within the dashboard to suit their individual data needs.
Article Contents
Access the Data Center
There are multiple ways to access the Data Center within Achieve3000 Literacy.
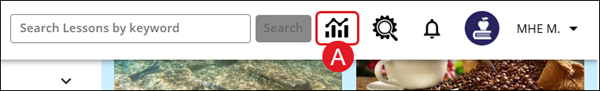
A. Click the Data Center icon at the top-right of the page.
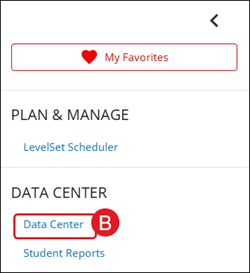
B. Click the menu button at the top-left of the page and click Data Center from the menu panel.
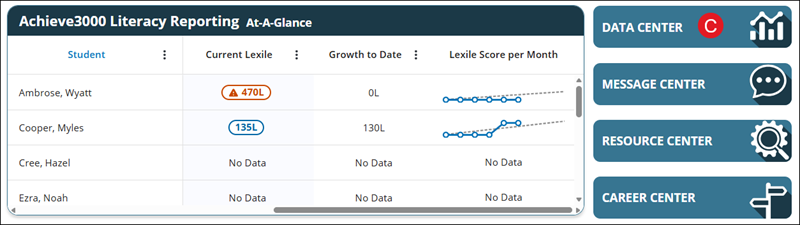
C. Click the Data Center button in the Achieve3000 Literacy Reporting At-A-Glance section on the home page.
Dashboard
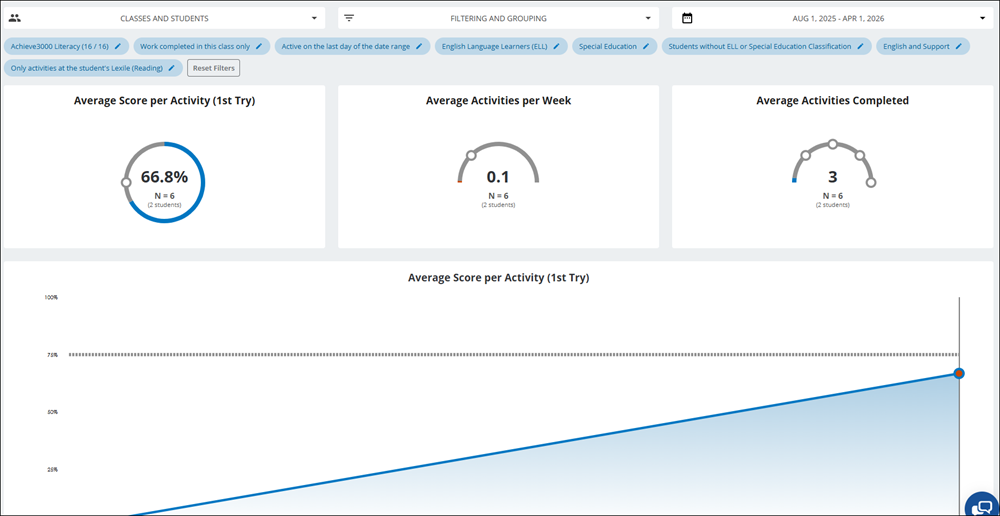
The Dashboard shows the teacher an overview of the Average Score per Activity (1st Try), the Average Activities per Week and Completed by students.
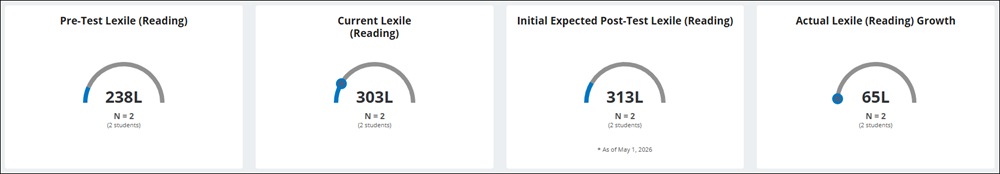
The page also provides details on Pre-Test, Current, Initial Expected Post-Test, and Actual Lexile data for the selected students.
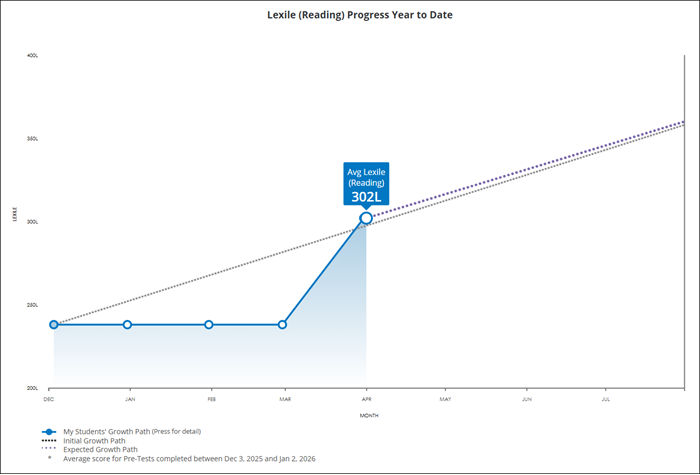
The Dashboard also provides a line graph showing the Lexile Progress Year to Date for reading for the selected students.
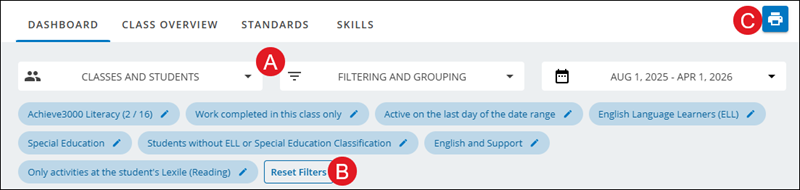
A. Teachers can adjust filters to what they are wanting to view in the report by clicking on each drop-down and checking/unchecking what they want included in the report view.
B. Click the Reset Filters button to change the filter selections back to default options.
C. Click the Print icon to download/save the current report view.
Class Overview Report
The Class Overview page provides a table with each rostered students' individual data. The data provided are Pre-Test, Expected Post-Test, Current, and Expected Current Lexile® levels, as well as the Lexile Score per Month. It also includes Activities Completed, Average Scores, and Score per Activity data.
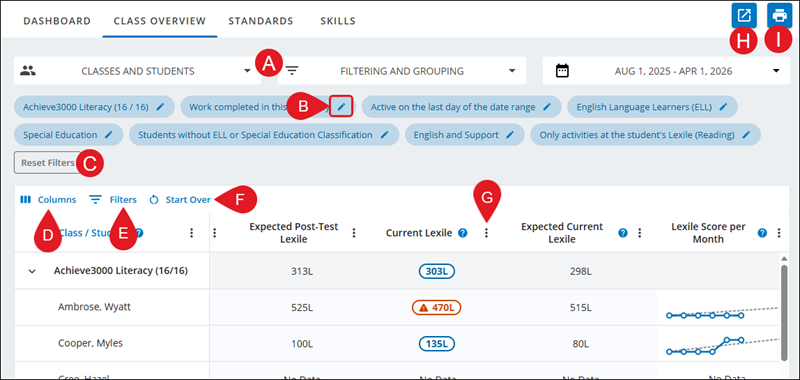
A. Teachers can adjust filters to what they are wanting to view in the report by clicking on each drop-down and checking/unchecking what they want included in the report view.
B. Click the pencil icon on a filter to easily select different options for that section.
C. Click the Reset Filters button to change the filter selections back to default options.
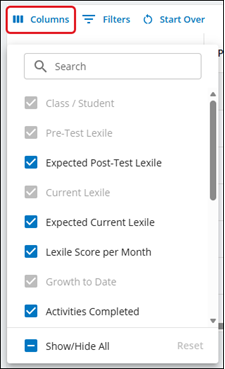
D. Click the Columns button to check/uncheck what is shown in the data table.
E. Click the Filters button to view specific criteria – such as those who are not performing well, but are completing a lot of activities.
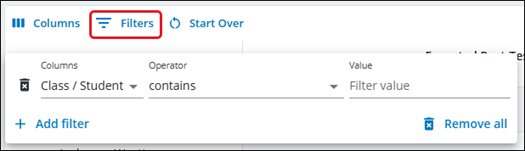
F. Click the Start Over button to reset the Columns and Filters back to their original selections.
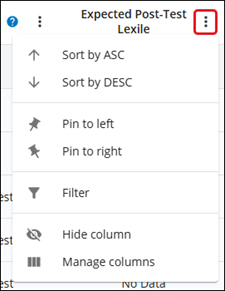
G. Click the Open Menu (kebob icon) button to sort, pin, filter, or hide the column.
Clicking Manage Columns in this menu will open the Columns menu.
Teachers can also click and drag each column to where they want it within the data table.
Note: If the page is refreshed, and if you did not pin the column, it will reset to its original view.
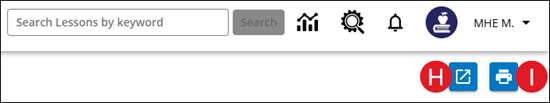
H. Click the Export to CSV button to save the data in an Excel file.
I. Click the Print button to download/save the current report view.
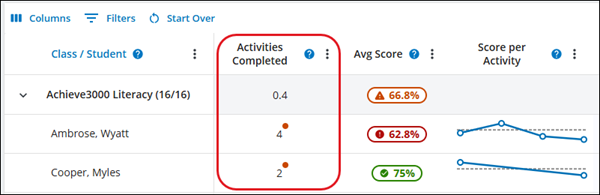
Activity Tracker
On the Class Overview page, click on the graph in the Score per Activity column to open the Activity Tracker. It will open in a side panel with additional data details for each activity that was completed by the student.
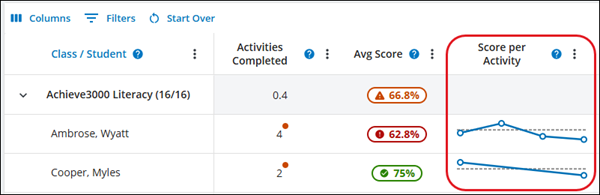
If you see a dot in the Activities Completed column this means that one or more activity score may be invalid. Open the Activity Tracker to view additional details.
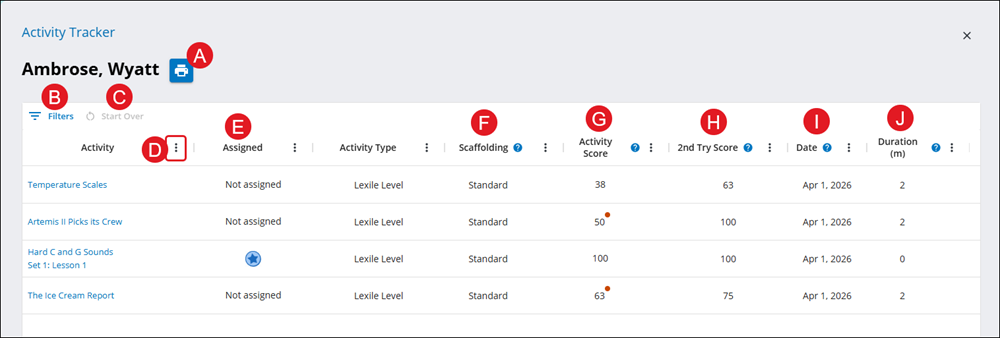
A. Click the Print button to download/save the current report view.
B. Click the Filters button to view specific criteria – such as those who are not performing well, but are completing a lot of activities.
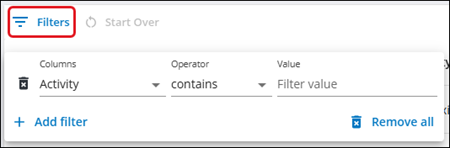
C. Click the Start Over button to revert the Filters selections back to the original options.
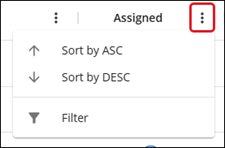
D. Click on the Open Menu (kebob icon) button to sort the column and/or add a filter.
E. The Assigned column shows if the student completed an activity chosen by themselves or was assigned by the teacher. Those with a star icon are ones that were assigned by the teacher.
F. The Scaffolding column shows the specific version(s) of the program to which the student has been assigned.
Note: Students who have been assigned the Intervention or Language Scaffolds receive double time on multiple choice activities before identifying potentially invalid activities that are not considered for Lexile reading measure adjustments.
G. The Activity Score displays the student’s First Try Score for each completed activity.
If a badge (dot icon) appears next to a score, that score did not contribute to consideration for Lexile adjustment because their first try score was below 75% and for one or more of the following reasons:
- The activity answers followed an unusual pattern like repeated answer or a repeated sequence.
- The activity was completed in less than 2 minutes.
- The activity was completed in more than 13 minutes. Please note: for students using the Support edition, the maximum time to complete an activity is 26 minutes.
- The activity was completed outside of Supervised Student Work Time (SSWT).
Note: This badge does not necessarily mean that the student’s work is invalid, only that the activity was completed outside of the parameters described above.
H. The 2nd Try Score column does not contribute to the student’s Lexile measure or monthly adjustment.
I. The Date this activity was completed.
J. The Duration (m) column displays the amount of time (in minutes) it took the student to complete the questions in the Respond step of the activity.
Standards Report
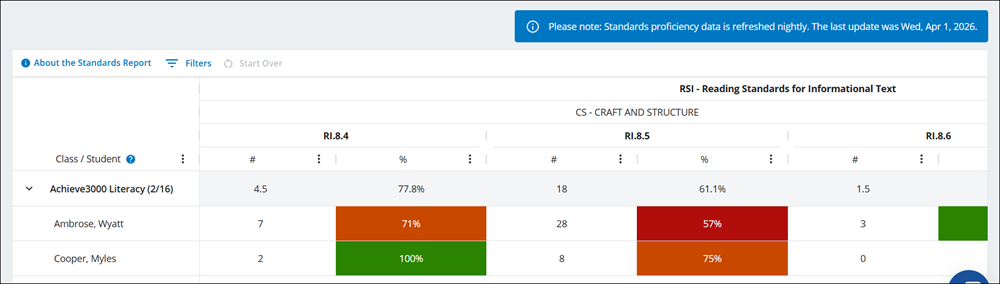
The Standards report calculates standards proficiency using data from all activities a student completes in Achieve Literacy. The table shows the average number of questions students have completed and the percent correct for questions for each listed standard and student.
Note: Standards proficiency data is refreshed nightly.
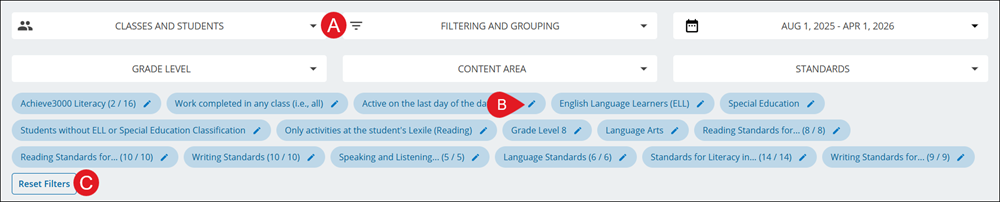
A. Click on a drop-down to select various filters to narrow down the data table view.
B. Click on the pencil icon on an individual filter to make changes to that option.
C. Click the Reset Filters button to revert filter selections back to the original options.
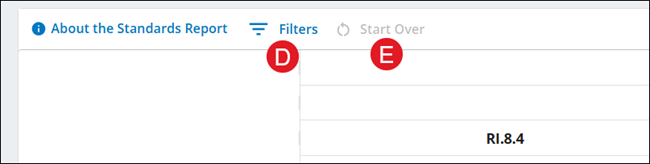
D. Click the Filters button to view specific criteria – such as those who are not performing well, but are completing a lot of activities.
E. Click the Start Over button to revert the Filters selections back to the original options.
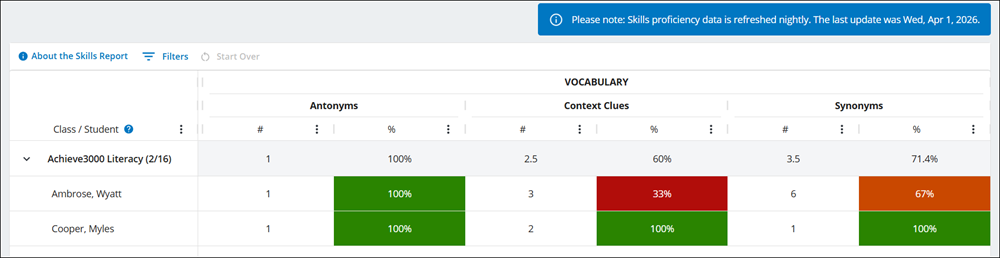
Skills Report
The Skills Report displays student performance in 3 categories: Proficiency Demonstrated, Additional Practice Recommended, and Intervention Recommended. The table shows the average number of questions students have completed and the percent correct for questions for each skill and student.
Note: Skills proficiency data is refreshed nightly.
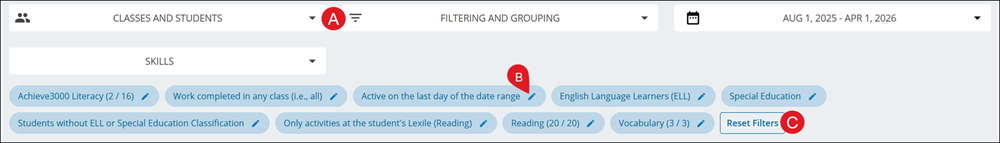
A. Click on a drop-down to select various filters to narrow down the data table view.
B. Click on the pencil icon on an individual filter to make changes to that option.
C. Click the Reset Filters button to revert filter selections back to the original options.
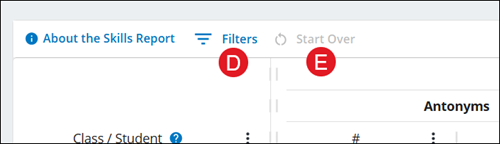
D. Click the Filters button to view specific criteria – such as those who are not performing well, but are completing a lot of activities.
E. Click the Start Over button to revert the Filters selections back to the original options.