HAR - How to capture a HAR File
Learn how to capture a HAR file in your browser to help McGraw Hill Support troubleshoot performance and loading issues.
- Higher Ed Student
- Higher Education
- School Parent
- Homeschooling Parent
- Customer Support
- Connect
- Instructor


It often helps development and engineering teams if they have the browser logs (HAR) when troubleshooting an issue. Below are the steps to generate a HAR while reproducing a reported issue.
.
Depending on which browser you are using, there are a few ways to generate a HAR file. Below are instructions for the most common way to obtain a HAR for Google Chrome and Firefox.
Google Chrome
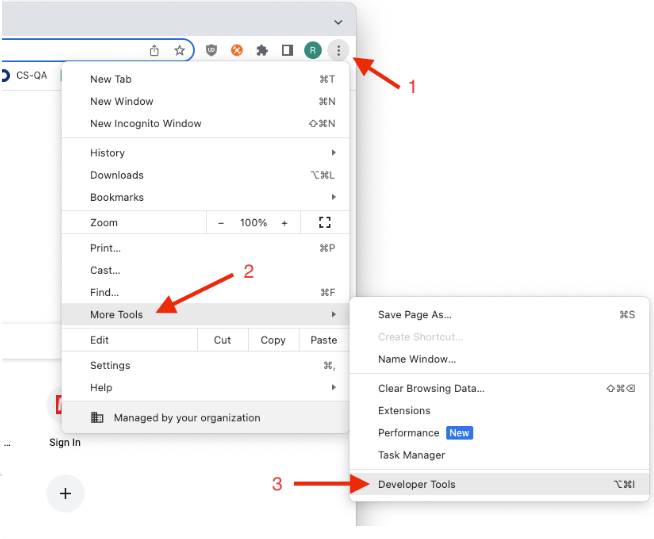
- Chrome menu
- Click on More Tools, followed by Developer Tools. Alternatively, you can right-click somewhere within the page and click Inspect.
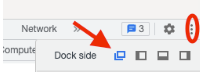
Note: You can set the Developer Tools window to open in a separate window by clicking the menu in the upper-right corner and clicking the first icon next to Dock side.
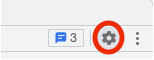
- After the developer window is opened for the first time, navigate to the settings menu (gear icon) and make sure the following settings are checked:
Network (top-right)
- Preserve log
Network (middle)
- Preserve log upon navigation
- Record network log
Global (bottom-right)
- Auto-open DevTools for popups
- Close the settings page and navigate to the Network tab within the Developer Tools window.
- Navigate back to the LMS course page and launch the LTIA widget.
- Attempt to reproduce the issue:
- If there is a problem with deployment, attempt to deploy the assignment and then use the Relink Assignments option in the widget. Complete the relink.
- If the issue is with Grade sync, run the sync for the affected assignment/student.
- Or, if given specific instructions in your escalation, follow those steps to capture the needed information.
Important:
After launching Connect or an assignment, a new tab will open. If the steps above were followed correctly, a new DevTools window will open as well. Make sure to export information from both of the DevTools windows:
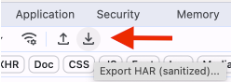
- In the Network tab of the Developer Tools window, click the download button for both DevTools windows.
- In the Console section, right-click and choose Save as..... Do this for both DevTools windows.
- Attach 2 HAR files and 2 Console log files to the ticket.
Firefox
If you are using Firefox, you can simply open the Developer Tools:
- Press F12 on your keyboard
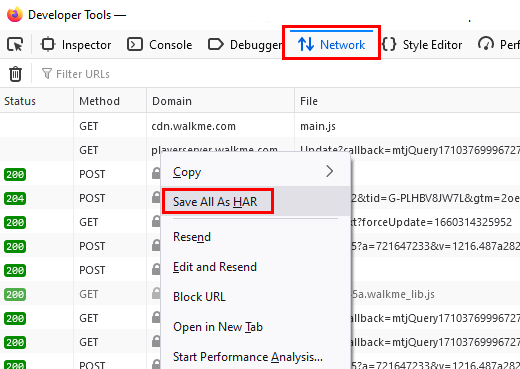
- Click the Network tab.
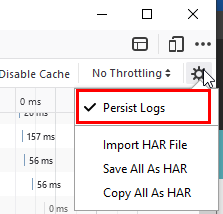
- To the top right of the console, click the cog and select the Persist Logs
- Leave the network tab open, and in the browser page reproduce the issue.
- After you have reproduced the issue, right-click on any line and select Save all as HAR
- Save the HAR to a location on your device then provide it to the Support Team
Safari
- Open Safari.
- In Safari, go to the webpage in question.
- Enable Developers Tool: Safari > Preferences > Advance > Click Show Develop menu in menu bar
- Select Develop in menu > Show Web Inspector > Select Network tab
- Within the Networks tab, select Preserve log option.
- Refresh the page and allow Safari to record the browser-website interaction.
- Once the page is loaded, click on Export on the top right in the window of the Network tab.
- Select the Console tab and screen capture the errors.
- Upload the HAR and console screenshot files to the support ticket.
MIcrosoft Edge
-
Open Microsoft Edge and go to the page where the issue is occurring.
-
Click on the 3 dots on the top right hand corner > More Tools > Developer Tools
-
Select the Network panel tab (you may need to click on >> and choose from a drop down list
-
Make sure Preserve log is ticked
-
Click on the concentric circle button (Or use the keyboard shortcut CTRL+E or Command+E) to start recording the session. The button will turn red and replace the filled inner circle with a filled square.
-
Refresh the page to replicate the error and allow Edge to record the browser-website interaction.
-
Select the same filled square button to stop recording the session.
-
Select the Export HAR button to export the recorded session to a HAR file. The button looks like an arrow pointing downwards to a horizontal line. It's on the same row as the Preserve log box. If you can't see it, you would need to resize the vertical bar and resize the Developer Tools window.