Connect - Creating category analysis reports
Create category analysis reports in Connect to evaluate performance by topic or outcome.
Tags
- Higher Education
- Customer Support
- Connect
- Instructor
- Reports & Analytics


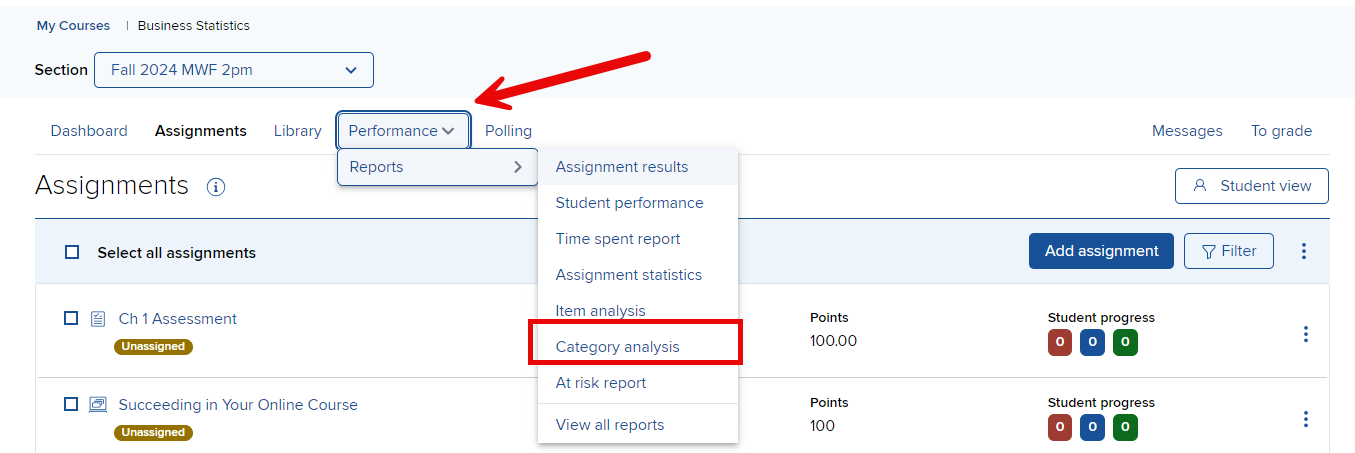
In your
Course-Section
home page, click
Category analysis from the
Performance >
Reports drop down list.
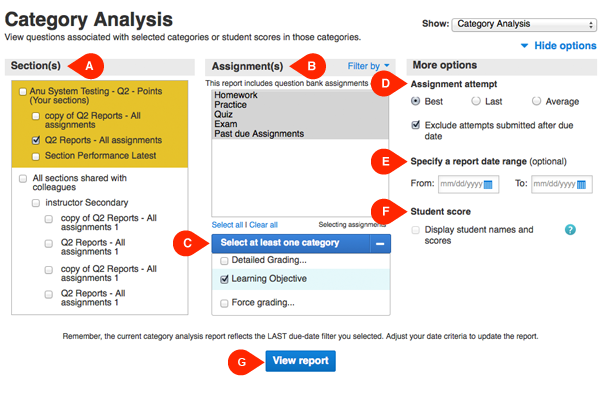
There are a variety of options from which you can choose to customize the report to best fit your needs.
Select Section(s) (A) – Select which sections of your course will be on the report. Choose from the current section, sections within the same course, and secondary instructor’s shared sections (if applicable).
Select Assignment(s) (B) – Select which assignments will be on the report. You can filter assignments by type and select or deselect multiple assignments by using the CTRL or Command keys while clicking assignment names.
Select at least one category (C) – Select at least one category to use in order to evaluate students' performance. These categories vary based on what section and assignments you choose. A category or category group is only available when a selected assignment contains a question with content related to this category or group.
Select Attempt (D) – Specify how the student assignment score is calculated and displayed when your students are allowed multiple attempts for an assignment.
Specify Report Date Range (E) – Specify an optional date range for the report. Select a From and To date using the calendar icon. Note: if you don’t see any scores when you click “view report” ensure the date range is wide enough to encompass the assignments you wish to view or the entire term.
Student Score (F) – Choose whether you want to view student scores.
View report (G) when you're ready to move on.
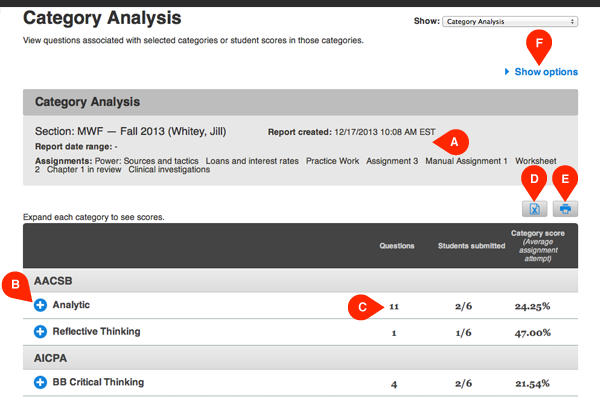
This is your category analysis report. At the top you’ll see a summary of the settings you selected in the last screen (A). Each category you chose to include can be broken down further. Click the blue arrow next to the title to see the assignment details (B). Listed next to each category you can find the number of questions assigned that relate to the topic (C), the number of students who have submitted answers out of the total number of students, and the average percent of how students are doing in that category. You can also export (D) or print (E) the report. Edit report options at any time by clicking show options (F).
There are a variety of options from which you can choose to customize the report to best fit your needs.
Select Section(s) (A) – Select which sections of your course will be on the report. Choose from the current section, sections within the same course, and secondary instructor’s shared sections (if applicable).
Select Assignment(s) (B) – Select which assignments will be on the report. You can filter assignments by type and select or deselect multiple assignments by using the CTRL or Command keys while clicking assignment names.
Select at least one category (C) – Select at least one category to use in order to evaluate students' performance. These categories vary based on what section and assignments you choose. A category or category group is only available when a selected assignment contains a question with content related to this category or group.
Select Attempt (D) – Specify how the student assignment score is calculated and displayed when your students are allowed multiple attempts for an assignment.
Specify Report Date Range (E) – Specify an optional date range for the report. Select a From and To date using the calendar icon. Note: if you don’t see any scores when you click “view report” ensure the date range is wide enough to encompass the assignments you wish to view or the entire term.
Student Score (F) – Choose whether you want to view student scores.
View report (G) when you're ready to move on.
This is your category analysis report. At the top you’ll see a summary of the settings you selected in the last screen (A). Each category you chose to include can be broken down further. Click the blue arrow next to the title to see the assignment details (B). Listed next to each category you can find the number of questions assigned that relate to the topic (C), the number of students who have submitted answers out of the total number of students, and the average percent of how students are doing in that category. You can also export (D) or print (E) the report. Edit report options at any time by clicking show options (F).